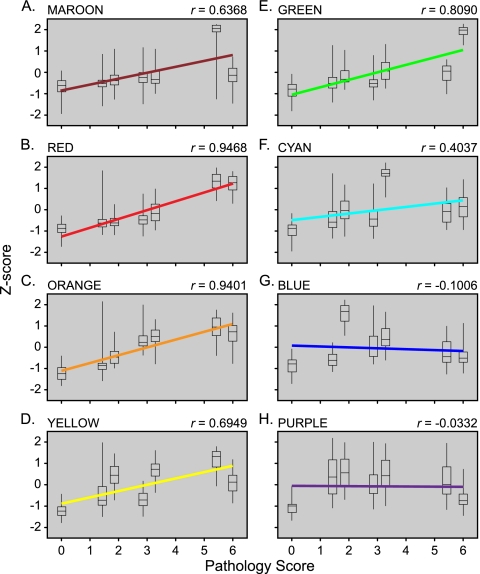
FIG. 4.
Linear regression of median Z-scores of spectral counts for proteins within individual clusters relative to pathology score following viral infection. Regression lines are color coded to indicate the representative cluster from Fig. 3 and as shown at the top left corner of each graph. Box plots represent interquartile ranges, and whiskers designate minimum and maximum values. The Pearson product-moment correlation coefficent values (r) are indicated on the upper right corner of each plot. The day 7 groups received the greatest pathology score during all infections. Tx91 scores were between 1 and 2, the 1918/Tx group received scores between 3 and 4, and HPAI caused the greatest damage, with scores between 5 and 6.

