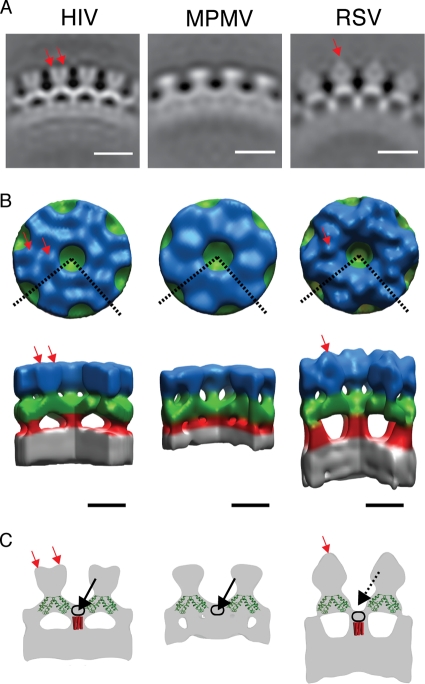
FIG. 2.
Structure of the in vitro-assembled Gag particles. (A) Radial section through the average structures. The density is white. The scale bar is 10 nm. (B) Surface rendering of the average structures. The color scheme follows an approximate radial division of the structure according to the different domains of Gag as previously assigned (6, 44, 45, 46): gray is the NC-nucleic acid layer, red is the SP1 region, green is the C-CA region, and blue is the N-CA. The dashed lines on the top view represent the section cut out in the side view. Red arrows indicate densities protruding from the N-CA density (see the text). Scale bar, 5 nm. (C) Sections through the isosurface representations (gray), illustrating features referred to in the text. The crystal structure of the CA dimer (PDB: 3ds2) (green) is superimposed on the sections indicated previously (6). Red rods indicate possible positions of a hypothetical 24-Å six-helix bundle. Red arrows indicate densities protruding from the N-CA density. Black arrows indicate density forming the floor of the hole in the C-CA ring. Black rings indicate possible positions of the residues between the final helix in the C-CA and the six-helix bundle. For explanations, see the text.

