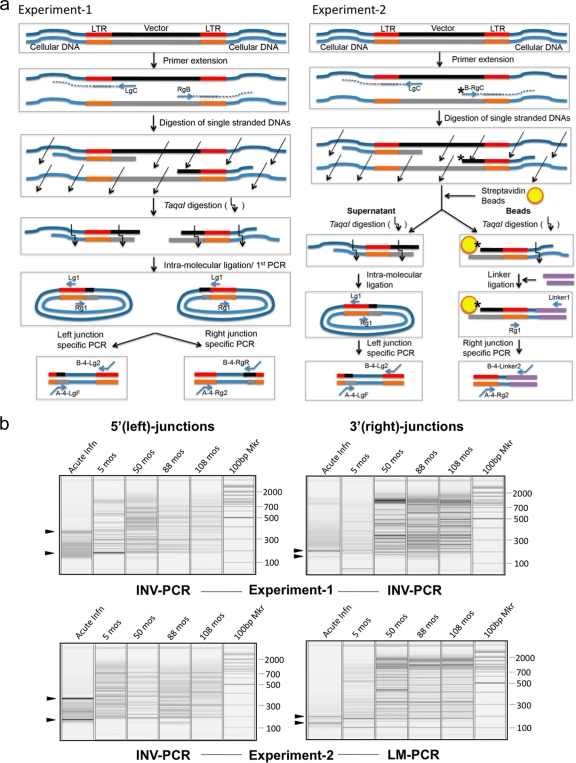
FIG. 2.
Bidirectional VIS analysis. (a) Schematic diagram outlining the major steps of the two approaches (experiment 1 and experiment 2) for the bidirectional VIS amplification. See Materials and Methods for a detailed description of the experimental procedures. Oblique arrows indicate nuclease digestion of single-stranded DNA. Bent arrows indicate TaqαI digestion. Ovals and stars (*) represent streptavidin beads and 5′ end biotins, respectively. DNA linkers for experiment 2 are denoted by double purple lines. (b) QIAEXEL capillary electrophoresis analysis. Bidirectional PCR analysis of acutely infected CD34+ cells (Acute Infn) and peripheral blood repopulating cells collected at 5, 50, 88, and 108 months (mos) posttransplant. Left junctions and right junctions were concurrently analyzed by either INV-PCR or LM-PCR during experiment 1 or experiment 2. A 100-bp marker (Mkr) is included in each panel. Arrowheads indicate DNA bands resulting from LTR circles after acute infection.

