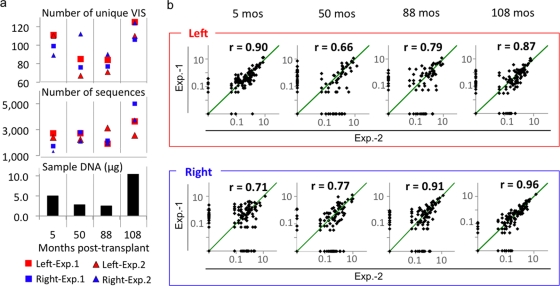
FIG. 4.
Sequence frequency analysis for unique VIS of <450 bp. (a) Both the amount of sample DNA and the number of available VIS sequences influence detection of unique VIS. The number of unique VIS and the number of VIS sequences from the left (red) and the right (blue) junctions generated by experiment 1 or experiment 2 as well as the amount of genomic DNA used in the analysis were displayed at each time point. (b) Reproducibility of the assay. The relative frequencies (percentage of total sequences for VIS DNA of <500 bp) for individual sites from the two experiments were plotted on logarithmic scales. Reproducibility was tested using a Pearson product-moment correlation coefficient (r). Green diagonal lines indicate complete frequency match (r = 1). Higher correlation was observed when >5 μg of genomic DNA and >2,000 VIS sequences were used for the analysis (PBC from 5 months and 108 months, respectively).

