Table 1.
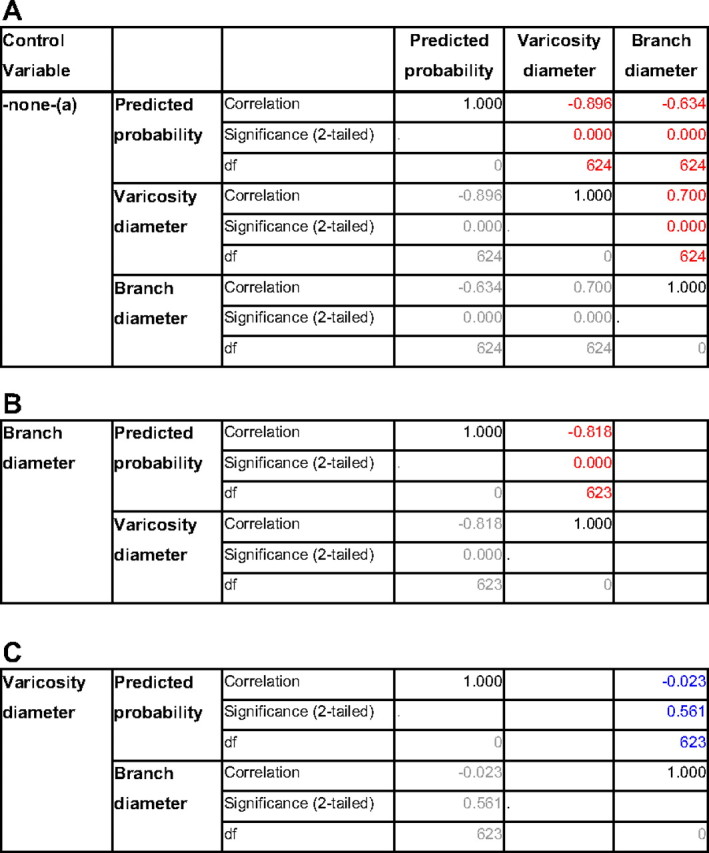
Partial correlation analysis showing that the difference in branch diameter is caused entirely by the difference in varicosity diameter

A, Zero-order correlations: both branch diameter and varicosity diameter correlate significantly with the predicted probability of the logistic regression model and with each other (highlighted in red). a, Cells contain zero-order (Pearson) correlations. B, After controlling for branch diameter, partial correlation between varicosity diameter and predicted probability is still highly significant, with only a marginal decrease of the correlation coefficient. C, After controlling for varicosity diameter, partial correlation between branch diameter and predicted probability is not significant (highlighted in blue), with a correlation coefficient close to zero.
