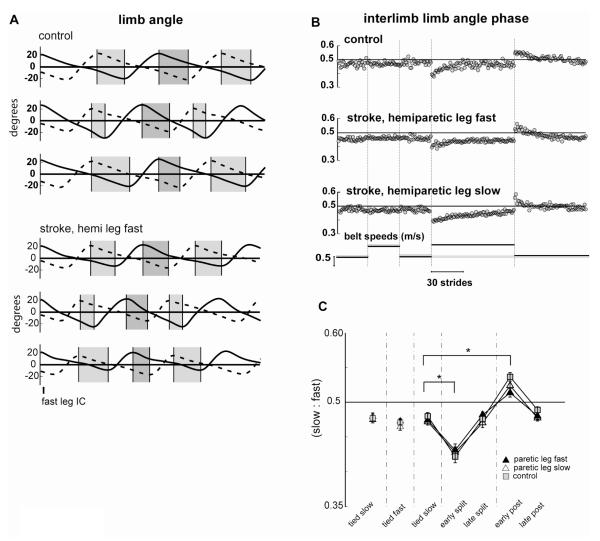
Figure 4.
Limb angle interlimb phase. A. Limb angles on the slow (dashed line) and fast (solid line) legs plotted over two successive strides from a typical control (top 3 pairs of traces) and stroke (bottom 3 pairs of traces) subject. Pairs of strides are from the Baseline (top), early Adaptation period (middle) and the early Post-adaptation period (bottom). All strides are aligned on the first initial contact (IC) on the fast leg. Light grey bars show the duration from peak limb flexion on the slow leg to peak limb extension on the fast leg; dark grey bars show the duration from peak limb flexion on the fast leg to peak limb extension on the slow leg. During symmetric walking, these two durations are equal (top trace); note the clear temporal shift in limb angles that occurs during the early Adaptation (middle trace) and early Post-adaptation (bottom trace) periods. These phase shifts are quantified over the duration of the limb angle cycle in the cross-correlation measures. B. Limb angle interlimb phasing values for sequential strides on the treadmill from the same control and stroke subject shown in A above. C. Average limb angle interlimb phasing values for the stroke subjects in the paretic leg slow session (open triangles), the paretic leg fast session (filled triangles) and for the control (squares) group. Each data point represents values averaged over the first five strides from the early or late portions of each testing period for each control and stroke subject individually and then averaged across all subjects in a group. Error bas indicate ± 1 SE.

