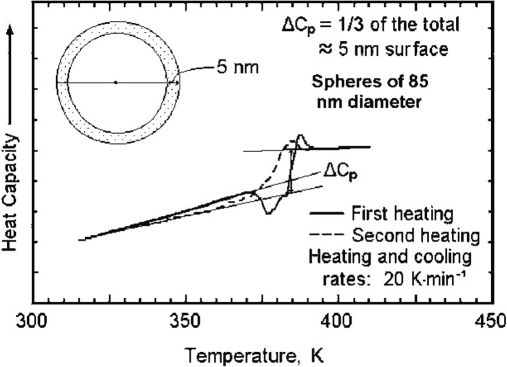
FIGURE 13.
Calculation of the surface volume of poly(styrene) to assess the lowering of the glass transition at the surface of small spheres based on DSC measurements. Note the ∼50 K shift of the beginning of the glass transition when going from the solid to the dashed line.202

