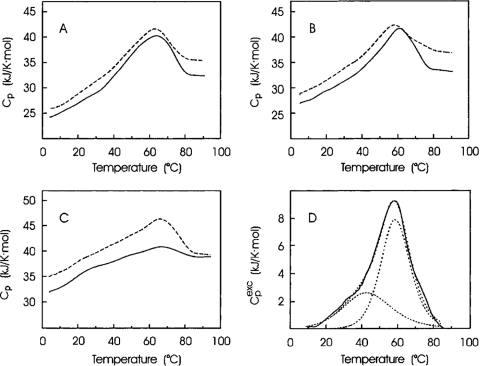
FIGURE 3.
Temperature dependence of the partial molar Cp of apoSynCaM mutants in 10 mM (dotted line) and 50 mM (solid line) sodium cacodylate buffer at pH 7.5: apoSynCaM8 (A), apoSynCaM12A (B), and apoSynCaM18A (C). (D) Computer deconvolution of the transition excess Cp (Cpexc) of apoSynCaM12A in 10 mM sodium cacodylate buffer at pH 7.5: experimental results (solid line), deconvoluted peaks, and their sum (dotted lines).5

