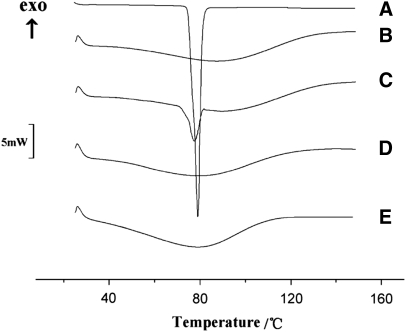
FIGURE 9.
DSC curves: (A) ibuprofen, (B) PVP, (C) PM of drug and PVP, (D) F1 fibers, (E) F2 fibers. DSC thermogram of pure ibuprofen exhibited a single endothermic response corresponding to the melting of the ibuprofen at 77.5°C. As an amorphous polymer, PVP K30 did not show any fusion peak or phase transition, apart from a broad endotherm, as a result of dehydration, which lies between 80°C and 120°C. DSC curves of F1 fibers and F2 fibers (D and E) did not show any melting peak of the drug but a broad endotherm ranging from 70°C to 110°C with the glass Tt (Tg) of F1 fibers higher than that of F2 fibers. For the PM, the endotherm broadened and was shifted slightly to a lower temperature (76.8°C), reflecting a partial change of ibuprofen crystal structure.149

