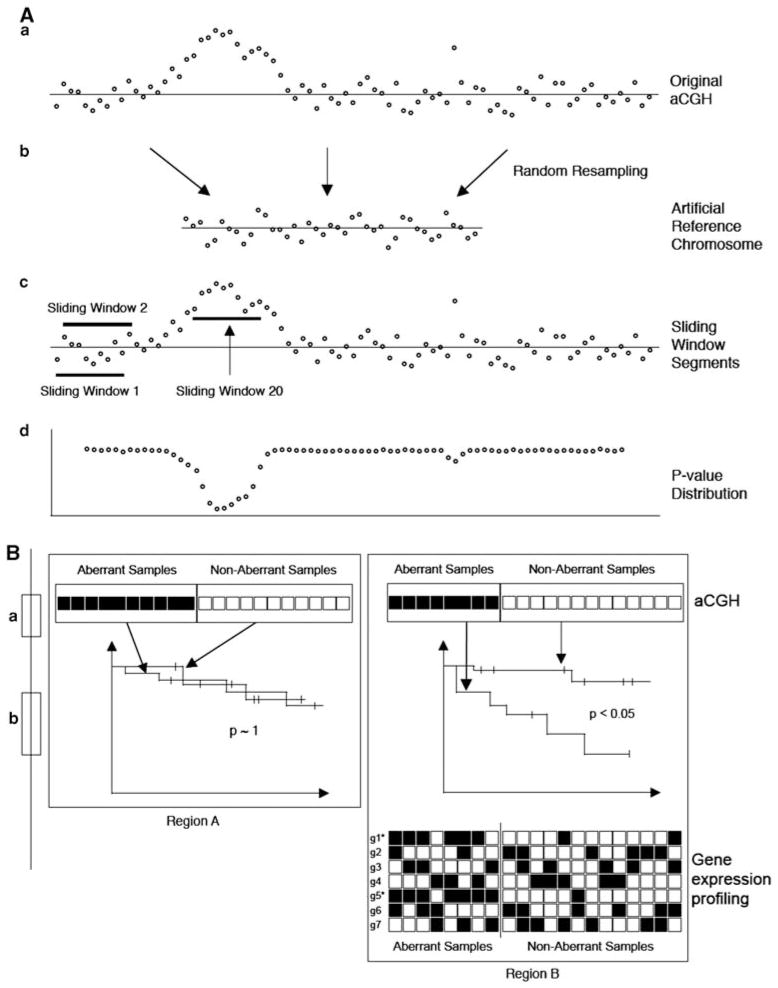
Figure 1.
The schematic diagram of the present approach. (A) Genomic aberration detection procedure and (B) the survival critical signature detection procedure are illustrated. (a) From the original aCGH, (b) a ‘reference’ chromosome is constructed and (c) a group of log-ratio values segmented by SWs are compared against those of the ‘reference’ chromosome, which subsequently result in (d) P-values. (B) Two chromosomal regions A and B are schematically compared here. aCGH data for each chromosomal regions are interrogated separately using the log-rank test to see whether survival difference is observed between samples that have genomic aberrations and those that do not. If statistically significant survival difference is observed (region B), expression profiles for genes in the chromosome region (g1,….,g7) are examined to see whether statistically significant association between copy number change and expression changes (gain and over-expression or loss and under-expression) can be detected using the Fisher’s exact test. Here, genes g1 and g5 show sufficient level of association and are marked*.

