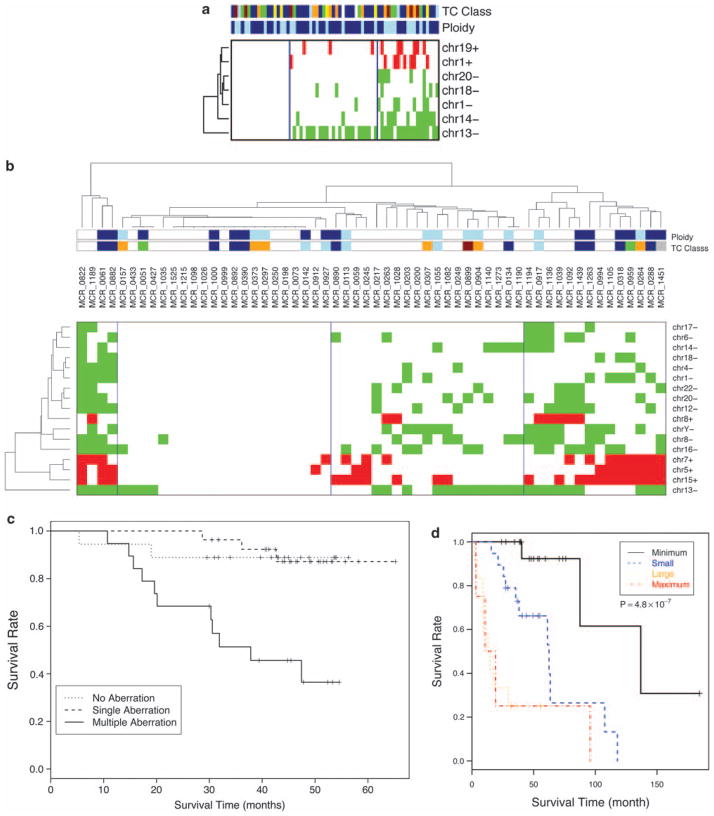
Figure 4.
Clustering of samples according to the presence of survival critical regions in MM. Patients segregate into clusters based on the number of survival critical regions in both the (a) Mayo cohort and the (b) UAMS cohort. The clusters are not enriched for any ploidy or TC subtypes. The survival of patients is significant worse in tumors with the highest number of these survival critical regions in both the (c) Mayo and (d) UAMS cohort.

