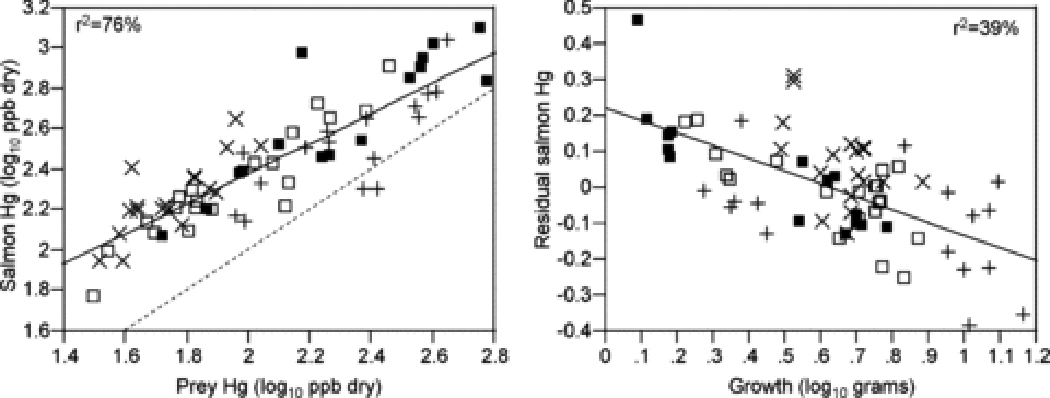
Figure 2.

Relationship between mean mercury (Hg) concentrations in salmon and mercury concentrations in their prey (left panel) and relationship between the residuals from the salmon-prey regression, an index of trophic transfer, and salmon growth as mean final mass (right panel). Each point is a study site and different symbols indicate different years (■: 2005; +: 2006; ×:2007; □: 2008). Solid lines are simple linear fits to pooled data. The dashed line is the 1:1 relationship between salmon and prey Hg concentrations. Based on a subset of samples analyzed for Hg speciation, 96% of Hg in salmon and 85% of mercury in prey is methylmercury.
