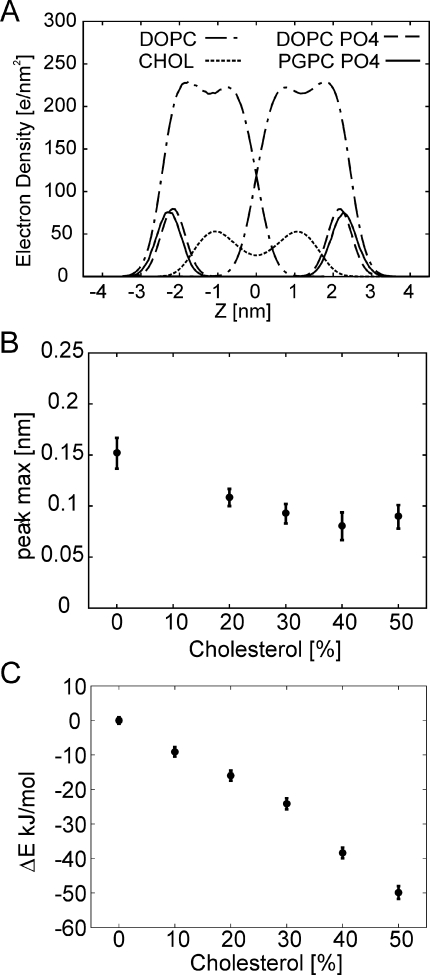
Figure 5.
Electron density profiles extracted from the MD trajectories. (A) Total electron density profiles of DOPC and cholesterol are shown along with the electron density of the phosphate groups of PGPC and DOPC, which are scaled for better visualization. Data are shown for 20% cholesterol. (B) We calculated the peak-shift in the maxima of the phosphate groups for DOPC versus PGPC, which is shown as function of cholesterol concentration. Error bars were determined by comparing peak position of the first half of the trajectory with the second half and by differences in peak to peak distances between upper and lower leaflets. (C) The cumulative potential energy of interaction with all membrane components per PGPC molecule is shown relative to the value obtained at 0% cholesterol content. Addition of cholesterol to the membrane increases the interaction strength while no changes where observed for interaction with the aqueous phase (not shown).

