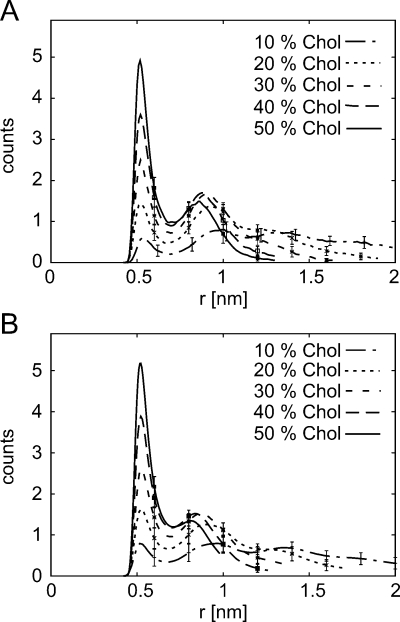
Figure 6.
Distribution of distances r between each phospholipid molecule (represented by its phosphate group) and the nearest cholesterol molecule (represented by its hydroxyl group). Plots represent averages over the entire trajectory and over all phospholipids of (A) PGPC and (B) DOPC. Bin-width is 0.02 nm. Standard deviation is shown for every 10th data point.

