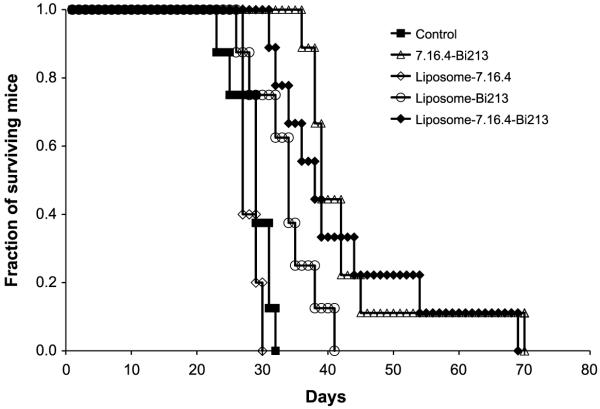
Figure 6.
Survival probability plot (Kaplan-Meier survival curve) for metastatic mouse model in neu-N transgenic mice with treatment groups that include 19.2 MBq of neu-targeted liposome-CHX-A”-DTPA-213Bi (n = 9), 19.2 MBq of nontargeted liposome-CHX-A”-DTPA-213Bi (n = 8), unlabeled targeted liposome-CHX-A”-DTPA (cold; n = 5), and the no-treatment control group (n = 8) and 4.44 MBq 213Bi-labeled 7.16.4 antibody (n = 9).

