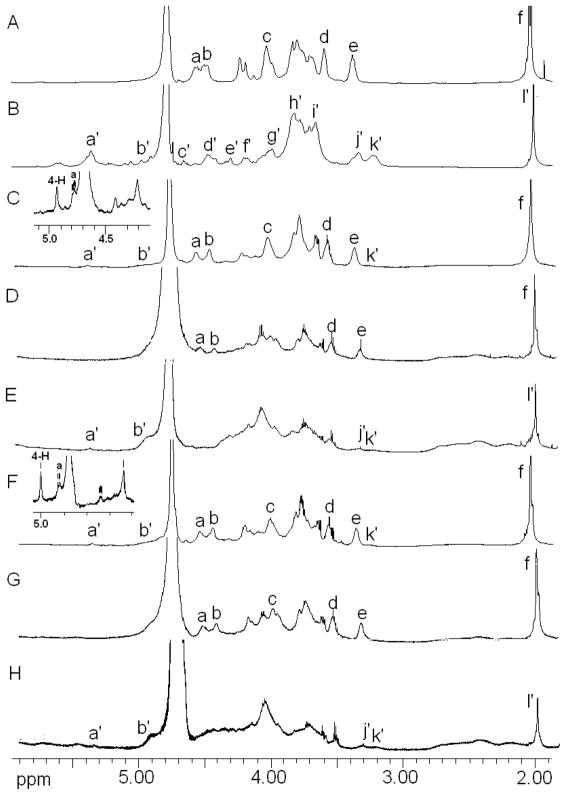
Fig. 3.
600 MHz 1H-NMR spectra of standard CS-A from bovine tracheal cartilage (A), standard heparan sulfate obtained from porcine intestine (B), total GAG from brain (C), CS from brain (D), HS from brain (E), total GAG from spinal cord (F), CS from spinal cord (G), and HS from spinal cord (H) recorded in D2O at 298 K. Signals, a, H-1 of GalNAc; b, H-1 of GlcA; c, H-2 and H-3 of GalNAc; d, H-3 of GlcA; e, H-2 of GlcA; f, CH3 of acetyl group of GalNAc; a′, H-1 GlcNAc or IdoA2S; b′, H-1 IdoA; c′, H-5 IdoA2S; d′, H-1 GlcA; e′, H-2 IdoA2S; f′, H-3 IdoA2S and H-6 GlcNS6S or GlcNAc6S; g′, and h′, H-2 and H-3 GlcNAc, H-6 and H-5 GlcNS or GlcNAc; i′, H-3 and H-4 GlcNS, GlcNAc, GlcNS6S or GlcNAc6S; j′, H-2 GlcA; k′, H-2 GlcNS or GlcNS6S; l ′ CH3 of acetyl group of GlcNAc.

