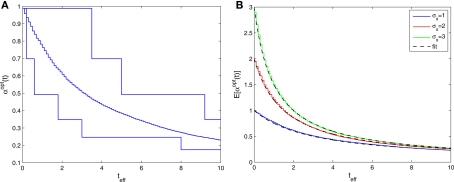
Figure 5.
(A) Sample realizations of optimal width processes for fast (bottom) and slow (top) spiking processes. The average over 1000 trials is plotted in the middle (σx = 1 and Δteff = 0.1). (B) Average optimal width processes for different values of prior standard deviation, all coinciding with the function

