Abstract
PURPOSE
To investigate objective measures of the effects of accommodative training of a pseudophakic eye implanted with a Crystalens AT-52SE (eyeonics Inc) intraocular lens (IOL) on reading performance, accommodation, and depth of focus.
METHODS
Objective dynamic measures of accommodation, pupil size, and depth of focus were quantified from wavefront measures before and after 1 week of accommodative training that began 29 months after implantation of an accommodating IOL in one patient. Depth of focus was estimated from 50% cut-off of peak performance levels for defocus curves that were computed from the image quality metric VSOTF based on ocular wavefront aberrations.
RESULTS
The patient reported improved near vision reading performance after completing the training procedure. After training, there was a shift in conjugate focus in the hyperopic direction, yet the depth of focus increased significantly for near objects. Simulated retinal images and the calculated modulation transfer function of the eye both demonstrated improved quality for near vision after training.
CONCLUSIONS
The subjective report of improved near vision after training was correlated with improvement of objective measures. Depth of focus increased for near objects with attempts to accommodate after training. This change was linked to increases in aberrations and pupil size and occurred despite the conjugate focus shifting in the hyperopic direction. These results demonstrate that accommodative training may be useful in improving near vision in patients with accommodating IOLs.
Accommodating intraocular lenses (IOLs) have recently been developed for implantation during cataract surgery. The Crystalens (eyeonics Inc, Aliso Viejo, California) was originally approved in the United States by the Food and Drug Administration in November 2003 as an accommodating IOL, making it the first accommodating IOL approved to provide postoperative accommodation.1 The Crystalens AT-52SE silicone, multipiece, posterior chamber IOL is surgically inserted into the capsular bag. It is designed to operate by translating the lens for and aft (optical-shift concept) in response to vitreous pressure changes due to ciliary muscle constriction and relaxation, respectively.2 The natural lens loses accommodative ability with age, while the ciliary muscle has been shown to retain function in the presbyopic eye through 80 years of age.3 Although clinical trials with the Crystalens accommodating IOL have shown an improvement in near, intermediate, and distance visual acuity when compared to monofocal IOLs,4 many of these studies are focused on the subjective measurement of visual acuity,5 and there is a need to investigate objective accommodation that changes conjugate focus and ocular aberrations that could increase the depth of focus during near vision tasks. Specifically, does the ocular refractive power increase with attempted accommodation (pseudophakic accommodation) and/or does the depth of focus increase as a result of changes in pupil size and increases in ocular lower and higher order aberrations?
An improvement in near vision could result from a number of factors. Factors influenced by the IOL would include a change in the conjugate focus to make the eye more myopic during attempts to accommodate, giving pseudophakic accommodation. Another possibility may be pseudoaccommodation resulting from an increase in higher order aberrations, particularly primary spherical aberration, that could give rise to an increased depth of focus. For example, changes in lens morphology during attempted accommodation could increase the negative range of the dynamic depth of focus and result in an increase of retinal image contrast of out-of-focus near targets6 imaged in a pseudophakic eye. Such an effect could be static, if it occurred at all times, or dynamic, if an increase in aberrations was a result of changes in lens position and/or shape occurring with attempts to accommodate. Of these factors, pseudophakic accommodation would be the most desirable outcome following accommodating IOL implantation, followed by dynamic pseudoaccommodation. Static pseudoaccommodation would be less desirable as distance vision would also be compromised due to the reduction in contrast associated with increased aberrations.
In addition to these lens-associated factors, a reduction in the pupil size could also lead to an increase in the depth of focus and hence improved near vision.7–9 The visual system may also adapt through the process of neural deblurring, resulting in better vision over time to reduced retinal image quality.10 It is possible that a combination of these factors may be at work to improve near vision in pseudophakic patients after accommodating IOL implantation. The current study investigates 1) the effects of accommodative training on near reading performance in a pseudophakic patient with implantation of a Crystalens AT-52SE IOL, 2) changes in conjugate focus during attempted accommodation (pseudophakic accommodation), 3) changes in depth of focus resulting from static and dynamic changes in ocular aberrations following training, and 4) changes in the pupil size during attempted accommodation. As the accommodating IOL implantation occurred 29 months before the current study, any neural adaptations to the lens would most likely have already occurred.
The study was conducted on a 61-year-old woman who underwent Crystalens AT-52SE accommodating IOL implantation 29 months prior to undergoing the accommodation training procedure. At the start of the study, the ocular aberrations, accommodation ability, and unaided reading ability were considered as baseline performance, and changes in reading ability and optical parameters measured after 1 week of subsequent training were considered to be a consequence of neuromuscular adaptation that altered accommodative responses and ocular aberrations.
PATIENTS AND METHODS
The patient began participation in the experiment in February 2010. In August 2007, a Crystalens AT-52SE accommodating IOL with an optical zone of 5 mm had been implanted in each eye for refractive reasons to improve reading performance without near spectacles. The patient did not have cataracts. The right lens had a power of 16.00 diopters (D) and the left lens a power of 15.50 D. The left eye had experienced surgical complications that resulted in reduced visual acuity so that only the right eye was studied. Refraction in the right eye was +0.25 −0.75 × 150 and corrected distance visual acuity was 20/16. Residual refractive error was not corrected during the experiment.
Wavefront measurements were made with natural pupils as measured by a wavefront aberrometer (Complete Ophthalmic Analysis System [COAS]; Wavefront Sciences Inc, Albuquerque, New Mexico). One set of measurements prior to training wavefront measurements were made with pupils dilated to 6 mm with four drops of phenylephrine hydrochloride ophthalmic solution USP 2.5%. The patient’s consent was received to perform the training exercises and testing for the experiment following institutional review board approval with adherence to the tenets of the Declaration of Helsinki.
Accommodation Training Procedure
One week of accommodation training consisted of several daily exercises performed at home. In the first exercise, training cards with type subtending 20/30, 20/40, and 20/50 letter sizes were viewed binocularly at a distance of 18 inches through two pairs of lenses (±0.50 D and ±0.75 D) in a hand-held mount that were rotated from the plus to minus lens pairs when the target appeared to clear with efforts of accommodation (lens flipper exercise). The patient was instructed to read the words on the card, reading one word through the negative lenses and the next through the positive lenses. She began training with the 20/50 letter size card and when she felt comfortable she moved on to the 20/40 and then 20/30 letter size cards. In a second training exercise, a 36-point font chart was placed at least 10 feet from the patient and a 12-point font chart was held at a comfortable reading distance of 18 inches. The patient viewed the targets binocularly and was asked to switch focus between the distance and near targets for 15 minutes each day. A third training exercise consisted of viewing the near-training card binocularly at arm’s length and slowly bringing it closer to her eyes while keeping the near target single. The patient reported that her total training time was 40 to 45 minutes per day.
Stimulation of Accommodation
In the laboratory, accommodation was stimulated by a reading card of 12-point type placed 0.5 m from the patient’s tested eye, providing a 2.00-D accommodative stimulus. The patient viewed it binocularly while measures were conducted on the right eye. Tonic measures of accommodation were conducted in the dark.11 For distance measurements, the target was a Snellen letter chart viewed at 5 m from the eye.
Whole-eye Ocular Wavefront Measurement
Whole-eye wavefront aberrations were measured in the stationary right eye using a Shack-Hartmann aberrometer that samples wavefront continuously at 30 Hz (COAS). The system has a spatial resolution of 210 μm (6-mm pupil) and has proven to be reliable for clinical testing.12 The aberrometer provided a binocular view of targets while aberrations of the right eye were measured over the natural pupil. Targets were viewed in real space through a half-silvered mirror periscope mounted on top of the COAS unit. The visual targets were aligned with the wavefront sensors super-luminescent-diode along the measurement axis. Each measurement was the mean of 300 sequential samples at 30 Hz obtained in a 10-second period. Blinks were manually removed from the data before analysis.
Zernike polynomials (up to 6th order) were calculated for each sampled frame. Dynamic accommodative status was calculated as the equivalent defocus by Eq.(1):
| (1) |
where r is the pupil radius in mm and RMSE is the root-mean-square error of the 2nd to 6th order Zernike coefficients.13
The natural pupil for each particular trial was used in these calculations. An advantage of equivalent defocus is that while it is not strictly invariant with pupil size, Thibos et al13 have shown that the equivalent defocus is largely independent of pupil diameter, making it a useful metric for comparison of wavefront aberrations of different pupil sizes, particularly in accommodation studies.14
Each trial measured ocular aberrations dynamically during a 10-second period to either the distance target placed at 5 m from the eye, the 2.00-D stimulus at 0.5 m, or in the dark. Three measures of each condition were conducted before and after training. All aberrations are in Optical Society of America (OSA) format.15
Data Analysis and Representation
Modulation Transfer Function
The method used to produce the modulation transfer function (MTF) is given in detail by Tahir et al.16 Briefly, the MTF was derived using a Matlab (Version 7.4; The Mathworks Inc, Natick, Massachusetts) routine. The model assumed a reduced schematic eye with refracting power of 60.00 D and refractive index of 1.32. A set of Zernike coefficients for a particular wavefront aberration was calculated to determine a pupil function. The squared modulus of the pupil function was used to construct the point spread function (PSF). The Fourier transform of this gave the optical transfer function (OTF) and the modulus of this, the MTF, describes how the contrast changes in the spatial frequency domain when an image passes through the optics of the eye.
Static and Dynamic Depth of Focus
Depth of focus was computed before and after training from defocus curves that were derived from image quality metrics analysis of the wavefront measured in the steady-state responses in the zero and non-zero accommodation stimulus conditions. Defocus curves were calculated from the simulated changes in the defocus term of the Zernike polynomial ranging from −2.50 to +2.50 D in increments of 0.25 D. Each calculation used the pupil size recorded by the aberrometer as measured during the trial. Minus and plus lenses correspond respectively to retinal images formed by targets nearer or farther from the ocular conjugate focus. The image quality metric used in the current study was the visual Strehl ratio (VSOTF) that is based on the phase and amplitude of the OTF in the frequency domain.17 The VSOTF has been shown to be among the most precise estimates of retinal image quality and is strongly correlated with subjective visual acuity.18–20 A second order polynomial was fit to plots of log-metric against linear defocus values (Fig 1). The depth of focus is estimated from the defocus range corresponding to a 50% reduction from the peak of the metric performance.21 The sum of the positive and negative defocus values for the 50% criterion equals the total depth of focus. The negative range of the depth of focus (as calculated from the peak of the metric curve) is of primary interest because it describes the near stimulus range that lies within the 50% performance criterion. The static depth of focus was quantified from the ocular wavefront measured for distance to no accommodative stimulus. Dynamic depth of focus was measured during attempted accommodation to non-zero D stimuli. Changes in depth of focus associated with attempted accommodation were compared for before and after training measures.
Figure 1.
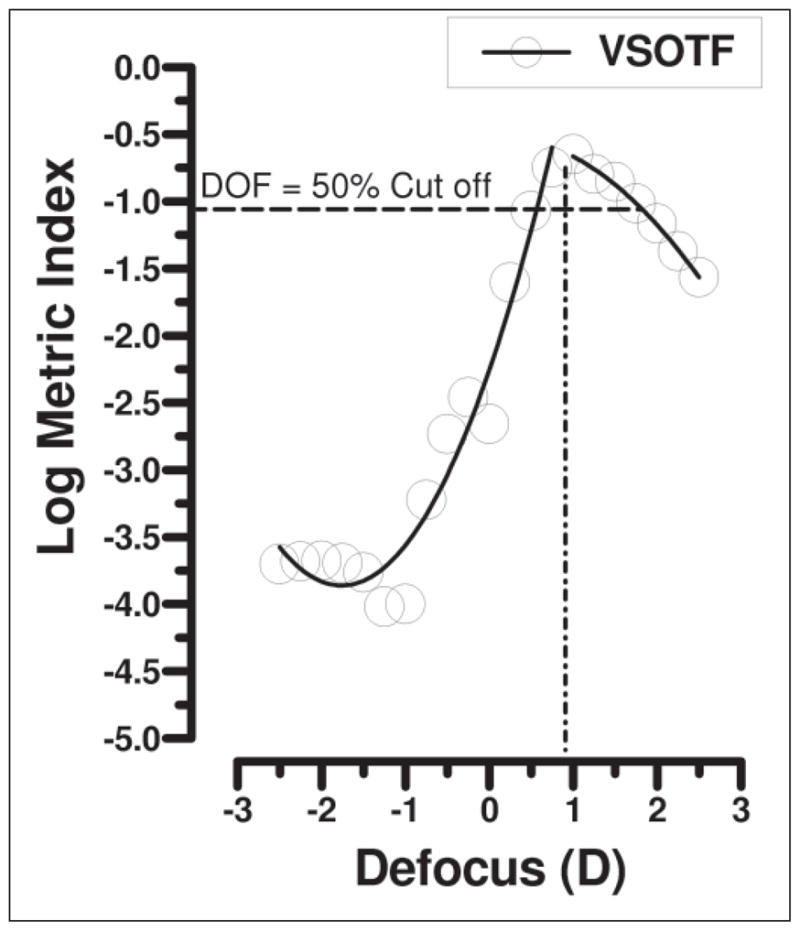
Example illustrating calculation of depth of focus (DOF) in diopters (D) from the visual Strehl ratio based on the optical transfer function (VSOTF) metric data. The peak indicates conjugate focus and 50% values on both positive and negative defocus values taken as depth of focus. Note that the example is for a near pre-training condition and demonstrates larger depth of focus in the positive range.
Static (Steady-state) Accommodation
Changes in conjugate focus during attempted accommodation were calculated from shifts of the peak of the metrics defocus curves in the far (0 D) and near (non-zero D) stimulus conditions.18,19
RESULTS
Training Compliance
The patient reported that she performed the training exercises daily for approximately 45 minutes on each occasion, including the morning of the post-training measurements. During the post-training session, the patient reported that her ability to focus on near targets with the lens-flipper exercise became slightly better, and that there was an improvement in her near focusing ability with the third training task where she was instructed to keep the letters single and clear while bringing them closer to her eyes. Before training, she was only able to read with the aid of near spectacles. Following training, she was able to read the newspaper for 30 minutes at 150 words per minute without the near spectacles that had been required for reading before training.
Dilated Pupil Wavefront Aberration Measurements
The RMSE (2nd to 6th order) of the wavefront aberrations for the dilated pupil condition (calculated for the central 4 mm of the dilated pupil) was measured for both distance and near targets. No significant increase in the wavefront aberration was seen with attempts to accommodate (two-tailed t test, t=1.15, P=.32). The retinal image quality as viewed through the dilated pupil may have been too blurred to provide an adequate stimulus for accommodation. Subsequent measurements were then conducted with a natural pupil. The added advantage of the natural pupil is that it mimics the normal viewing experience of the patient.
Natural Pupil Wavefront Aberration Measurements and Depth of Focus Metrics
The equivalent defocus in diopters was calculated using Eq.(1) before and after training. There was an increase in equivalent defocus after training (mean 1.45±0.12 D) compared with before training (1.18±0.01 D) in the near target condition, and this shift was found to be significant (two-tailed t test, t=3.99, P=.016). No significant effect was found for a similar comparison of the distance aberrations (two-tailed t test, t=−0.16, P=.88).
To investigate the impact of the increase in aberration during attempts to accommodate after training, the depth of focus was calculated using the VSOTF metric as described above. Figure 1 illustrates an example of the log-metric plot against simulated plus and minus defocus values for the wavefront in the 2.00-D stimulus condition (before training measurement). Note that negative diopters denote near targets and positive diopters denote distance targets.
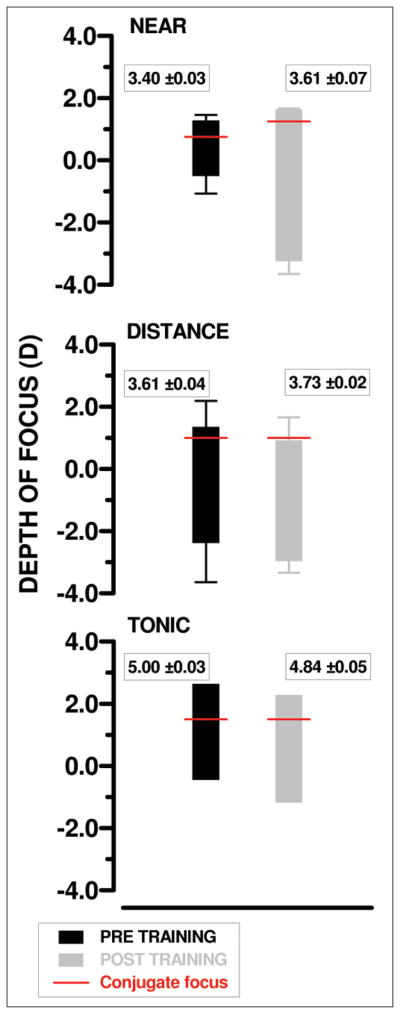
The depth of focus was calculated for each condition: near (2.00-D target), distance, and tonic. The mean depth of focus values for the VSOTF are shown in Figure 2 for both before and after training measurements. A significant increase in the negative depth of focus for the near target was found when comparing before and after training measures (two-tailed t test, t=3.27, P=.03), but not in either the distance (two-tailed t test, t=0.71, P=.52) or tonic conditions. The conjugate focus shifted in the hyperopic direction (towards more positive) for the near post-training condition compared with the near pre-training measurements while no shift was observed for the distance or tonic measurements.
Figure 2.
Depth of focus in diopters (D) as calculated from the visual Strehl ratio based on the optical transfer function (VSOTF) metric data for near (top), distance (center), and tonic (bottom) viewing conditions. Measurements for distance and near are the mean of three trials and error bars indicate standard deviation. Red lines show conjugate focus. Pupil diameters (mean±standard deviation in mm) for each condition are given alongside depth of focus metric. Note that negative diopters denote the near stimulus target range while positive denote distance.
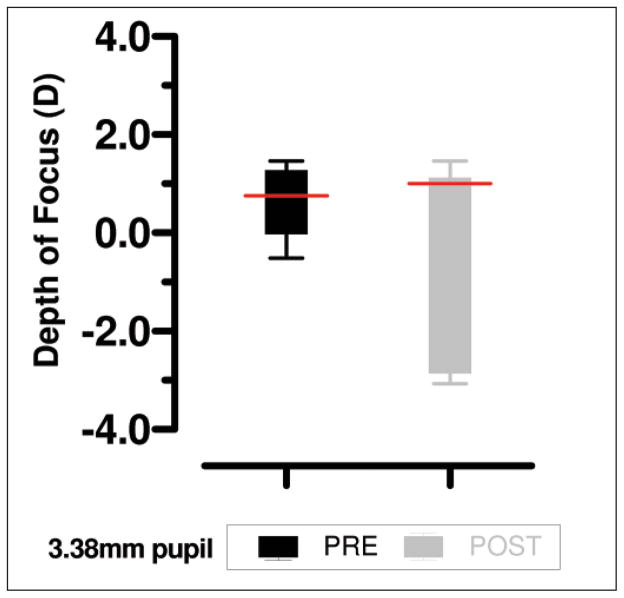
While the equivalent defocus was larger after training, the pupil size was significantly smaller before training (two-tailed t test, t=4.61, P<.01). There is a relationship between pupil size, aberrations, and depth of focus. Generally, decreasing the pupil size will increase depth of focus and so it would be expected that smaller pupils would have larger depth of focus. However, larger pupils manifest higher ocular aberrations, which can also increase depth of focus.6 To investigate the effect of pupil size, aberrations, and depth of focus, the aberrations for all near trials were resized to a 3.38-mm pupil (the smallest pupil size measured) using the method described by Campbell22 and both the equivalent defocus and VSOTF metrics were recalculated at this pupil size. After resizing the pupil, the difference in equivalent defocus was no longer significant (before training, mean=0.59 and variance=0.0001; after training, mean=0.66 and variance=0.005; two-tailed t test, t=2.00, P=.12) but the depth of focus still showed a large increase after training compared with before training measures (Fig 3). This indicates that both pupil size and aberrations interact to produce the larger depth of focus in the post-training trials but there was certainly an increase in pseudoaccommodation after training.
Figure 3.
Depth of focus as calculated from visual Strehl ratio based on the optical transfer function (VSOTF) metric data near viewing conditions. Measurements are based on a resized 3.38-mm pupil diameter for the mean aberrations of three trials. Red lines indicate conjugate focus. Error bars indicate standard deviation.
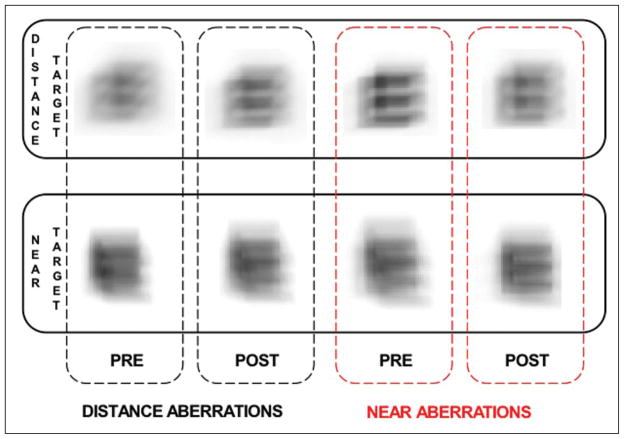
It is interesting to note that the depth of focus is large for both distance and near conditions. However, there is no shift in the conjugate focus (as indicated by the red lines in Figure 2) for these conditions, while there is a shift in the near post-training condition (distance conjugate focus is +1.00 D whereas near is +1.25 D), indicating that an attempt at accommodation was made after training for the near condition. The large depth of focus at the distance conditions is a result of the larger pupil size in these measurements (see pupil values given in Figure 2). However, this large depth of focus does not translate into better or as good near vision as the post-training near measures. This is demonstrated in Figure 4 using simulated retinal images.
Figure 4.
Simulated retinal image for a 20/50 Snellen E letter at distance (0.20 D) and near (2.00 D) viewing distances using aberrations as measured for distance viewing (left figures, black outline) and near viewing (right figures, red outline).
Simulated Retinal Images and Modulation Transfer Function
To further illustrate the improvement of the retinal image quality with near targets after training, the retinal images of a 20/50 Snellen E at a far (0.20 D) and near (2.00 D) stimulus condition are shown in Figure 4 for the two accommodation states (responses to far and near targets). Images were computed from the convolution of the Snellen E with the PSF of the eye in the unaccommodated and accommodated stimulus conditions. Using the PSF measured under distance viewing conditions (see Fig 4, left panels, black outline) the retinal image is clearer with higher contrast for the distance target (top figure) compared with the near (bottom figure). This is also the case for the near measurements (see Fig 4, right panels, red outline) for the pre-training retinal image, indicating a poor attempt at accommodation. However, the post-training measurement has a clearer image with higher contrast at the near viewing distance, illustrating the effect of the increased post-training depth of focus that was shown in Figure 2.
Figure 5 demonstrates the increased depth of focus in the post-training trials, displaying the retinal image for a range of near targets at different dioptric distances (−1.50 D, −2.00 D, and −2.50 D) convolved with the PSF as measured under the near viewing conditions both before and after training. The increased depth of focus after training provides superior retinal images compared with the pre-training condition at all three viewing distances.
Figure 5.
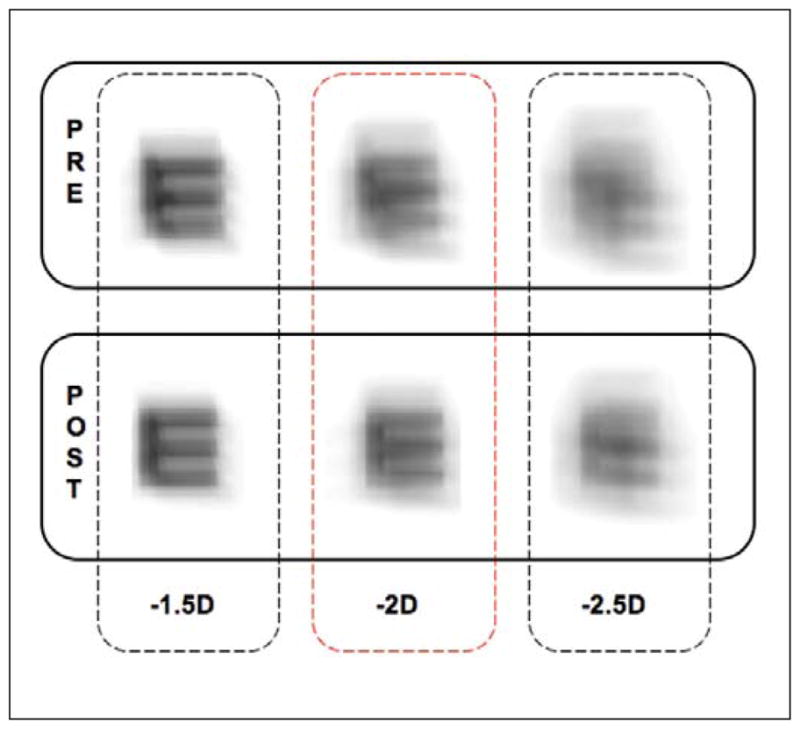
Simulated retinal image for a 20/50 Snellen E letter at near (1.50, 2.00, and 2.50 D) viewing distances. Images produced using aberrations measured when viewing 2.00-D target both before (top) and after (bottom) training. Note the clearer images after training compared with pre-training conditions.
From the wavefront aberrations measured before and after training, the MTF for the eye can be calculated (see Methods for details). Figure 6 shows the MTF for a near target (2.00 D) for both before and after training. For this example, the trial with the best response at each visit was used. Areas where the MTF drops below zero indicate a phase reversal, which are related to spherical defocus and aberrations present in the optics of the eye and produce spurious resolution in vision.23,24 The spatial frequency cut-off was taken as the point where the MTF remained below zero. It can be seen that the MTF is higher for the post-training condition and also has a higher cut-off spatial frequency, again demonstrating the superior near vision after training.
Figure 6.
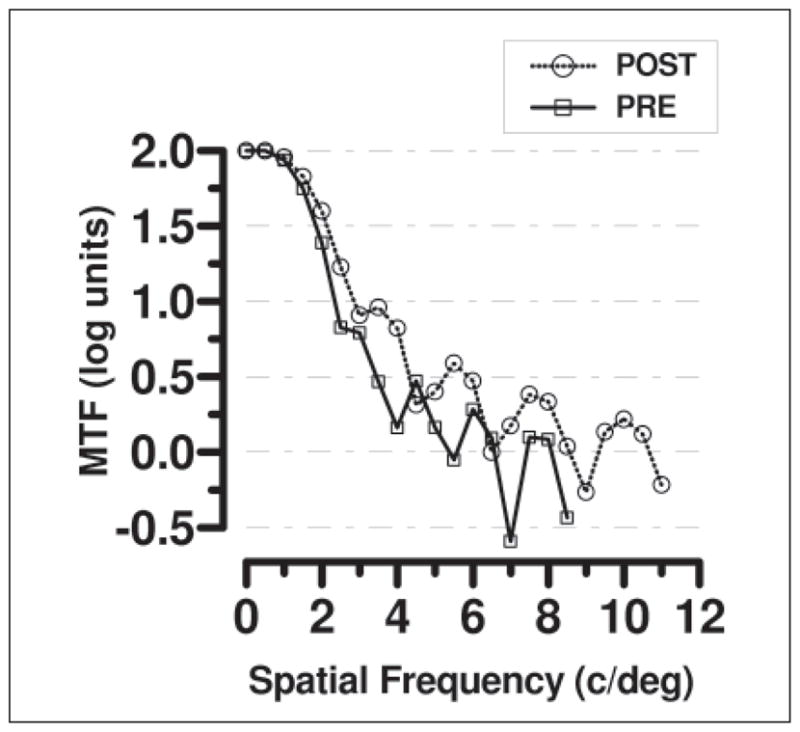
Modulation transfer function (MTF) (log units) as calculated for a near target (2.00 D) using before (square symbol, continuous line) and after (circle symbols, dashed line) training wavefront aberrations. Best response from each of the three trials measured at each visit are shown. Note the higher MTF and higher spatial frequency cut-off for the post-training measurements.
DISCUSSION
This study has demonstrated an increase in the negative range of the depth of focus and reading performance following training of a pseudophakic patient with the Crystalens AT-52SE lens which had been implanted for 29 months. The increase in depth of focus was associated with both a hyperopic shift in the conjugate focus and an increase in the equivalent defocus of the wavefront aberrations. Such a change was not seen in either the far or tonic conditions, indicating that it was associated with attempts to accommodate.
As discussed in the introduction, there were four possible reasons for an improvement in near vision that were investigated in this report. The first of these was pseudophakic accommodation, ie, a shift in the conjugate focus with attempts to accommodate. Whereas a shift was seen after training, it was not only small in size (0.25 D) but also in the hyperopic direction, which would make near vision worse. The small magnitude of the shift is most likely due to the increased anteroposterior thickness of the ciliary muscle25 while the backward shift of the lens, producing hyperopia, has been reported previously in AT-45 Crystalens patients.26
Another possibility was a static change in the aberrations that would result in a larger depth of focus. A comparison of the before and after training measurements for the far and tonic conditions indicates that this was not the case in our patient. Rather, the improvement in depth of focus and retinal image quality seen in the post-training near condition compared with far measurements indicates a dynamic change in depth of focus during attempted accommodation (pseudoaccommodation). That the dynamic depth of focus and retinal image quality improved after training compared with pre-training conditions demonstrates that the training exercises had an effect. The pupil size was also found to play a role, with a significant increase in the pupil size for near targets after training. The effect of this was to increase aberrations and hence the depth of focus at near vision. The relationship between pupil size and aberrations has been reported by Sakai et al,27 who have shown that the level of aberration present in an eye has an influence on pupil size. They found that a light adapted pupil showed significant positive correlation with the image quality metric neural sharpness. Our findings are consistent with their observations.
The findings from the computed metric depth of focus calculations are supported by the simulated retinal images shown in Figures 4 and 5. In Figure 4, the clearest Snellen E near target (2.00 D) is that from the post-training near measurements. The increased depth of focus after training is also demonstrated by the increased clarity of the Snellen E at a range of near distances (1.50, 2.00, and 2.50 D) compared with pre-training measures. The calculated MTF also showed the same trend of improvement for near vision after training.
It is interesting that these changes were not seen with a dilated pupil, most probably due to the increased image blur that exceeds the range of useful stimuli for accommodation.28 Our findings emphasize the need for studies to be conducted using natural pupils when investigating accommodative effort in accommodating IOLs.
Although the results discussed here are from one patient and require verification from a larger sample size that we are currently in the process of collecting, they indicate a potential for improving the near vision of patients with accommodating IOLs with training exercises. While industry continues to produce new lens designs, and indeed the Crystalens AT-52SE has already been replaced with a newer design, the potential improvement in near vision through training should be applicable to future lenses. Similarly, the objective measures of performance described herein should prove more useful in reporting the effects of new lens types than purely subjective measures that have dominated in the past.5
Acknowledgments
This study was supported by NIH grant EY017678.
The authors thank Dr. Stephen G. Turner for patient referrals and Christopher Burns, Cheyenne Huber, and Charles Zhao for their assistance in development of psychophysical procedures and programs for dynamic wavefront measurement and analysis.
Footnotes
The authors have no financial or propriety interest in the materials presented herein.
Presented at the International Congress on Wavefront and Presbyopic Refractive Corrections; February 26–28, 2010; San Francisco, California.
AUTHOR CONTRIBUTIONS
Study concept and design (S.G., I.V., C.M.S.); data collection (H.J.T., J.L.T., S.G., C.M.S.); analysis and interpretation of data (H.J.T., J.L.T., S.G., C.M.S.); drafting of the manuscript (H.J.T., S.G., C.M.S.); critical revision of the manuscript (J.L.T., S.G., I.V., C.M.S.); obtained funding (C.M.S.); administrative, technical, or material support (C.M.S.); supervision (C.M.S.)
References
- 1. [Accessed August 2010];CrystaLens™ Model AT-45 Accommodating IOL - P030002. Available at: http://www.fda.gov/MedicalDevices/ProductsandMedicalProcedures/DeviceApprovalsandClearances/Recently-ApprovedDevices/ucm095565.htm.
- 2.Coleman DJ. On the hydraulic suspension theory of accommodation. Trans Am Ophthalmol Soc. 1986;84:846–868. [PMC free article] [PubMed] [Google Scholar]
- 3.Strenk SA, Semmlow JL, Strenk LM, Munoz P, Gronlund-Jacob J, DeMarco JK. Age-related changes in human ciliary muscle and lens: a magnetic resonance imaging study. Invest Ophthalmol Vis Sci. 1999;40(6):1162–1169. [PubMed] [Google Scholar]
- 4.Cumming JS, Colvard DM, Dell SJ, Doane J, Fine IH, Hoffmann RS, Packer M, Slade SG. Clinical evaluation of the Crystalens AT-45 accommodating intraocular lens: results of the U.S. Food and Drug Administration clinical trial. J Cataract Refract Surg. 2006;32(5):812–825. doi: 10.1016/j.jcrs.2006.02.007. [DOI] [PubMed] [Google Scholar]
- 5.Findl O, Leydolt C. Meta-analysis of accommodating intraocular lenses. J Cataract Refract Surg. 2007;33(3):522–527. doi: 10.1016/j.jcrs.2006.11.020. [DOI] [PubMed] [Google Scholar]
- 6.Nio YK, Jansonius NM, Fidler V, Geraghty E, Norrby S, Kooijman AC. Age-related changes of defocus-specific contrast sensitivity in healthy subjects. Ophthalmic Physiol Opt. 2000;20(4):323–334. [PubMed] [Google Scholar]
- 7.Tucker J, Charman WN. The depth-of-focus of the human eye for Snellen letters. Am J Optom Physiol Opt. 1975;52(1):3–21. doi: 10.1097/00006324-197501000-00002. [DOI] [PubMed] [Google Scholar]
- 8.Holladay JT. Refractive power calculations for intraocular lenses in the phakic eye. Am J Ophthalmol. 1993;116(1):63–66. doi: 10.1016/s0002-9394(14)71745-3. [DOI] [PubMed] [Google Scholar]
- 9.Nakazawa M, Ohtsuki K. Apparent accommodation in pseudophakic eyes after implantation of posterior chamber intraocular lenses: optical analysis. Invest Ophthalmol Vis Sci. 1984;25(12):1458–1460. [PubMed] [Google Scholar]
- 10.Mon-Williams M, Tresilian JR, Strang NC, Kochhar P, Wann JP. Improving vision: neural compensation for optical defocus. Proc Biol Sci. 1998;265(1390):71–77. doi: 10.1098/rspb.1998.0266. [DOI] [PMC free article] [PubMed] [Google Scholar]
- 11.Schor CM, Kotulak JC, Tsuetaki T. Adaptation of tonic accommodation reduces accommodative lag and is masked in darkness. Invest Ophthalmol Vis Sci. 1986;27(5):820–827. [PubMed] [Google Scholar]
- 12.Cheng X, Himebaugh NL, Kollbaum PS, Thibos LN, Bradley A. Validation of a clinical Shack-Hartmann aberrometer. Optom Vis Sci. 2003;80(8):587–595. doi: 10.1097/00006324-200308000-00013. [DOI] [PubMed] [Google Scholar]
- 13.Thibos LN, Hong X, Bradley A, Cheng X. Statistical variation of aberration structure and image quality in a normal population of healthy eyes. J Opt Soc Am A Opt Image Sci Vis. 2002;19(12):2329–2348. doi: 10.1364/josaa.19.002329. [DOI] [PubMed] [Google Scholar]
- 14.Radhakrishnan H, Charman WN. Age-related changes in ocular aberrations with accommodation. J Vis. 2007;7(7):11.1–21. doi: 10.1167/7.7.11. [DOI] [PubMed] [Google Scholar]
- 15.Thibos LN, Applegate RA, Schwiegerling JT, Webb R. Standards for reporting the optical aberrations of eyes. J Refract Surg. 2002;18(5):S652–S660. doi: 10.3928/1081-597X-20020901-30. [DOI] [PubMed] [Google Scholar]
- 16.Tahir HJ, Parry NR, Pallikaris A, Murray IJ. Higher-order aberrations produce orientation-specific notches in the defocused contrast sensitivity function. J Vis. 2009;9(7):11. doi: 10.1167/9.7.11. [DOI] [PubMed] [Google Scholar]
- 17.Ravikumar S, Thibos LN, Bradley A. Calculation of retinal image quality for polychromatic light. J Opt Soc Am A Opt Image Sci Vis. 2008;25(10):2395–2407. doi: 10.1364/josaa.25.002395. [DOI] [PubMed] [Google Scholar]
- 18.Chen L, Singer B, Guirao A, Porter J, Williams DR. Image metrics for predicting subjective image quality. Optom Vis Sci. 2005;82(5):358–369. doi: 10.1097/01.opx.0000162647.80768.7f. [DOI] [PubMed] [Google Scholar]
- 19.Cheng X, Bradley A, Thibos LN. Predicting subjective judgment of best focus with objective image quality metrics. J Vis. 2004;4(4):310–321. doi: 10.1167/4.4.7. [DOI] [PubMed] [Google Scholar]
- 20.Yi F, Iskander DR, Collins MJ. Estimation of the depth of focus from wavefront measurements. J Vis. 2010;10(4):1–9. doi: 10.1167/10.4.3. [DOI] [PubMed] [Google Scholar]
- 21.Legge GE, Mullen KT, Woo GC, Campbell FW. Tolerance to visual defocus. J Opt Soc Am A. 1987;4(5):851–863. doi: 10.1364/josaa.4.000851. [DOI] [PubMed] [Google Scholar]
- 22.Campbell CE. Matrix method to find a new set of Zernike coefficients from an original set when the aperture radius is changed. J Opt Soc Am A Opt Image Sci Vis. 2003;20(2):209–217. doi: 10.1364/josaa.20.000209. [DOI] [PubMed] [Google Scholar]
- 23.Smith G. Ocular defocus, spurious resolution and contrast reversal. Ophthalmic Physiol Opt. 1982;2(1):5–23. [PubMed] [Google Scholar]
- 24.Atchison DA, Woods RL, Bradley A. Predicting the effects of optical defocus on human contrast sensitivity. J Opt Soc Am A Opt Image Sci Vis. 1998;15(9):2536–2544. doi: 10.1364/josaa.15.002536. [DOI] [PubMed] [Google Scholar]
- 25.Strenk SA, Strenk LM, Guo S. Magnetic resonance imaging of the anteroposterior position and thickness of the aging, accommodating, phakic, and pseudophakic ciliary muscle. J Cataract Refract Surg. 2010;36(2):235–241. doi: 10.1016/j.jcrs.2009.08.029. [DOI] [PMC free article] [PubMed] [Google Scholar]
- 26.Koeppl C, Findl O, Menapace R, Kriechbaum K, Wirtitsch M, Buehl W, Sacu S, Drexler W. Pilocarpine-induced shift of an accommodating intraocular lens: AT-45 Crystalens. J Cataract Refract Surg. 2005;31(7):1290–1297. doi: 10.1016/j.jcrs.2005.03.055. [DOI] [PubMed] [Google Scholar]
- 27.Sakai H, Hirata Y, Usui S. Relationship between residual aberration and light-adapted pupil size. Optom Vis Sci. 2007;84(6):517–521. doi: 10.1097/OPX.0b013e31806dba43. [DOI] [PubMed] [Google Scholar]
- 28.Allen MJ. The stimulus to accommodation. Am J Optom Arch Am Acad Optom. 1955;32(8):422–431. doi: 10.1097/00006324-195508000-00006. [DOI] [PubMed] [Google Scholar]


