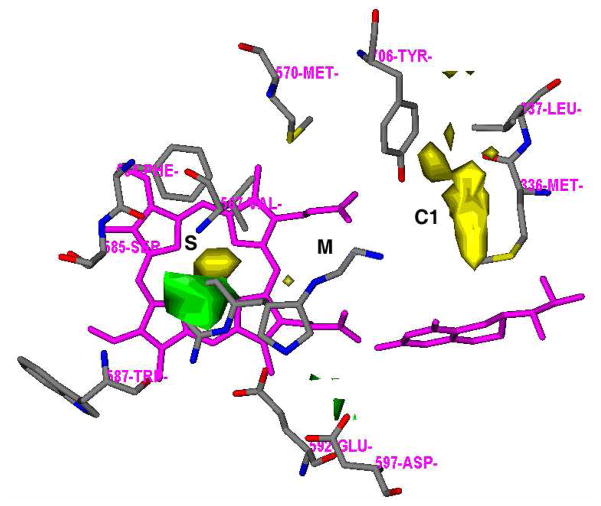
Figure 4.
Results of the GRID analyses of the substrate-binding site of nNOS (PDB id: 1P6I) illustrates the direction of lead optimization. The residues and inhibitor 5 are represented in an atom-type style (carbons in grey, nitrogens in blue, oxygen in red, and sulfur in yellow). Heme and H4B are colored magenta. The S, M, and C1 pockets are indicated. The GRID contours of the DRY probe (yellow) is set at an energy level of −0.75 kcal/mol. The GRID contours of the C3+ probe (green) is set at an energy level of −4.00 kcal/mol.

