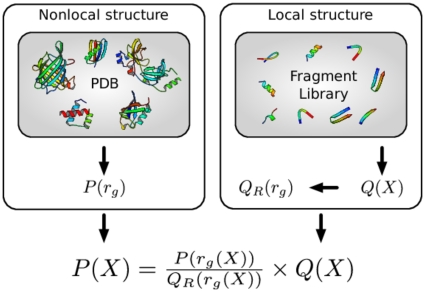
Figure 1. Illustration of the central idea presented in this article.
In this example, the goal is to sample conformations with a given distribution  for the radius of gyration
  , and a plausible local structure.
  could, for example, be derived from known structures in the Protein Data Bank (PDB, left box).
  is a probability distribution over local structure
  , typically embodied in fragment library (right box). In order to combine
  and
and  in a meaningful way (see text), the two distributions are multiplied and divided by
  (formula at the bottom);
  is the probability distribution over the radius of gyration for conformations sampled solely from the fragment library (that is,
  ). The probability distribution
  will generate conformations with plausible local structures (due to
  ), while their radii of gyration will be distributed according to
  , as desired. This simple idea lies at the theoretical heart of the PMF expressions used in protein structure prediction.

