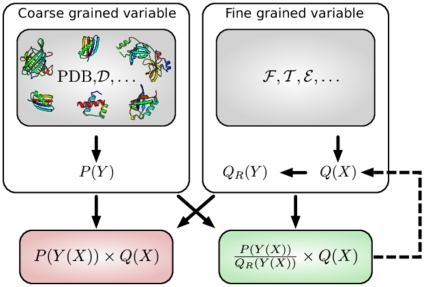
Figure 2. General statistical justification of PMFs.
The goal is to combine a distribution  over a fine grained variable
  (top right), with a probability distribution
  over a coarse grained variable
  (top left).
  could be, for example, embodied in a fragment library (
 ), a probabilistic model of local structure (
 ) or an energy function (
 );
);  could be, for example, the radius of gyration, the hydrogen bond network, or the set of pairwise distances.
  usually reflects the distribution of
  in known protein structures (PDB), but could also stem from experimental data (
 ). Sampling from
  results in a distribution
  that differs from
  . Multiplying
  and
and  does not result in the desired distribution for
  either (red box); the correct result requires dividing out the signal with respect to
  due to
  (green box). The reference distribution
  in the denominator corresponds to the contribution of the reference state in a PMF. If
  is only approximately known, the method can be applied iteratively (dashed arrow). In that case, one attempts to iteratively sculpt an energy funnel. The procedure is statistically rigorous provided
  and
and  are proper probability distributions; this is usually not the case for conventional pairwise distance PMFs.

