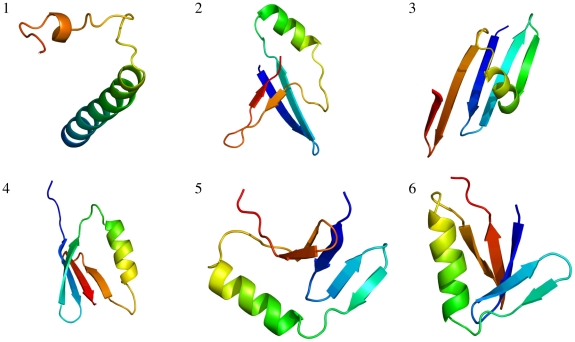
Figure 5. Highest probability structures for each iteration.
The structures with highest probability out of 50,000 samples for all six iterations (indicated by a number) are shown as cartoon representations. The N-terminus is shown in blue. The figure was made using PyMOL [64].

