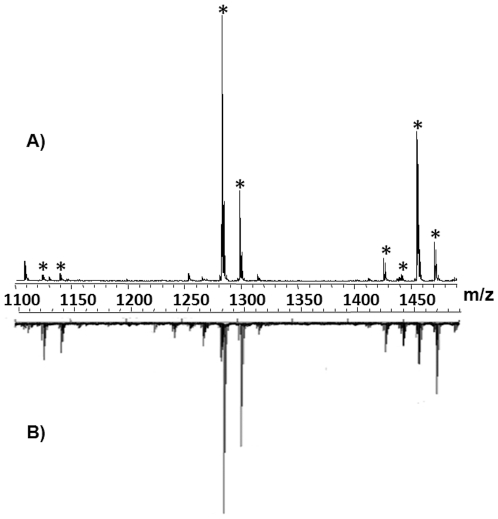
Figure 2. Detection of Saponins by MALDI direct tissue analysis.
Comparison of an average mass spectrum of the Cuvierian tubules of Holothuria forskali obtained by direct MALDI-MSI (A) and a mass spectrum obtained by classical MALDI-MS analysis after extraction and purification of saponins from the tubules (B). Saponin ions are marked by an asterisk.

