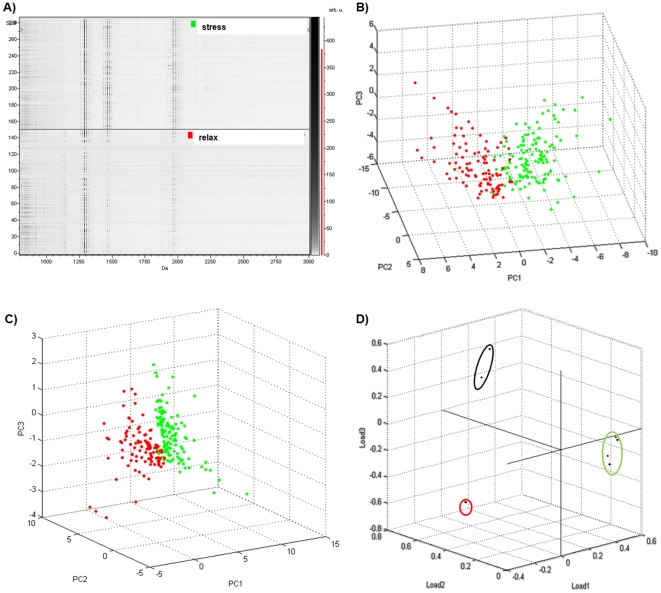
Figure 5. Comparison of saponins composition between stressed and relaxed holothuroids.
(A) Pseudogel view of 300 mass spectra from the Cuvierian tubules of Holothuria forskali: spectra from stressed holothuroids (upper part) and from relaxed holothuroids (lower part). (B and C) scores plot of first, second and third principal component considering all the ions (B) or only the saponin ions (C) in the MALDI spectra. Each data point represents one mass spectrum (red, relaxed; green, stressed). (D) Scores plot of first, second and third loading considering only the saponin ions. Each data point represents one m/z ratio.

