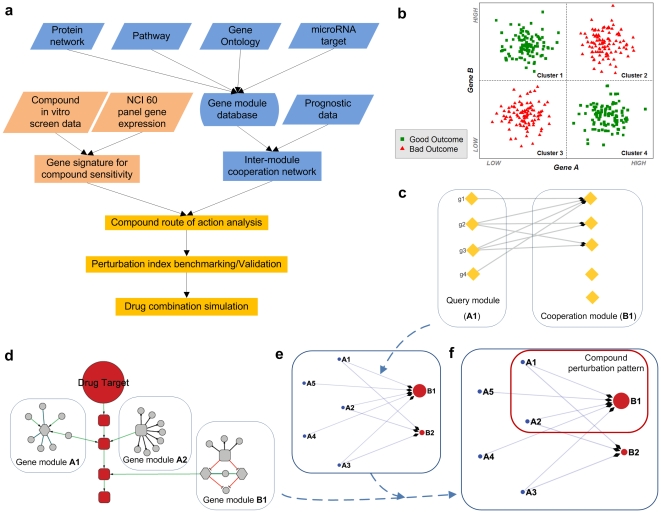
Figure 1. The proposed schema for compound Pattern of Action (POA) analysis.
a. The workflow of POA analysis, which relies on converging two lines of information: the intrinsic module structure which cooperatively determine the clinical prognosis outcome of heterogeneous patient population (blue rectangles); and the gene signatures for compound sensitivity resulting from in-vitro cell line screen (pink rectangles). b. Illustration of the ‘synergistic outcome determination’ (SOD), a proposed in vivo gene-gene functional interaction. SOD is defined as the synergy of a gene pair with respect to cancer patients' outcome. Here gene A and gene B have two states: high expression or low expression level. Red triangles represent ‘bad outcome’ patients (shorter survival time or metastasis), and green rectangles represent ‘good outcome’ patients (longer survival time or non metastasis). In combination, the two genes are sufficient to determine the patient outcome, but each of them individually is uncorrelated with patient outcome. For example, given gene A state as ‘low expression’, all patients with A(Low) are distributed in two clusters and thus insufficient to determine the patients outcome. Given combination of A and B state, i.e., A(Low) B(high), its sufficient to determine the patient outcome as ‘good outcome’. c. Inter-module cooperation network construction. For each gene (g1∼g4 at left) in a given gene module, we identify their synergistic partner genes (the link from gene in module A1 to gene module B1 form a ‘Synergistically Inferred Nexus’, see Methods ). Then the gene modules which are over-represented in the resulting gene list are identified as the ‘cooperative modules’ corresponding to the query gene module. d. Compound perturbation pattern. Genes associated with compound sensitivity (nodes within blocks) might be topologically cross-linked to the functional pathway (red rectangles) induced by compound perturbation. e. Disease specific inter-module cooperation network, nodes represent gene modules and the direct link represents the relationship between the ‘query module’ (A1) and its ‘cooperative module’ (B1). Here B1 cooperates with a large number of modules (with flow-in links), thus we called this special class of modules ‘gatekeeper modules’ (B1, B2) and others (without flow-in links) as ‘checkpoint modules’ (A1–A5). f. The Pattern of Action (POA) of one candidate compound generated by overlapping the disease-specific inter-module network (e) with the module hits by sensitivity-associated genes (d).

