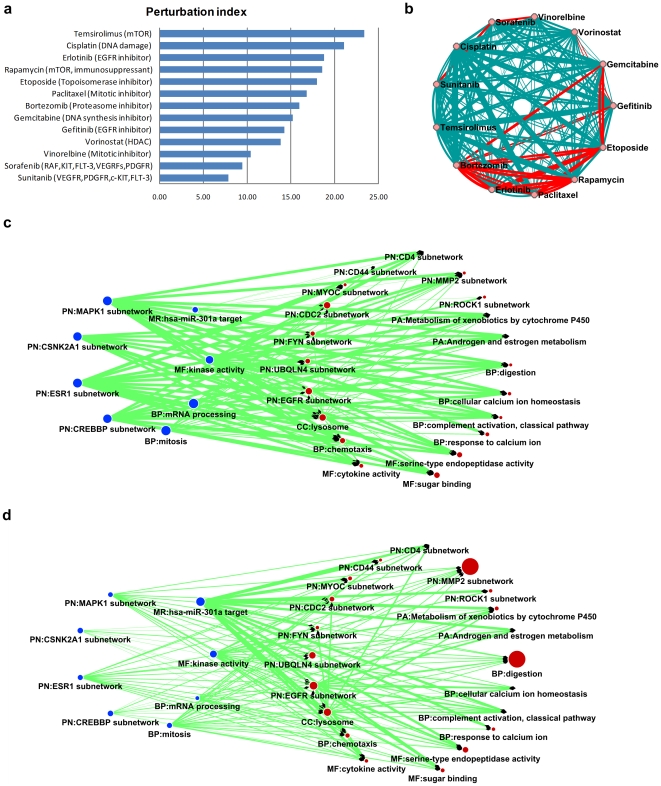
Figure 5. A proof-of-principle demonstration for a drug combination study based on POA analysis.
a. Rank of drugs and agents in clinical development for lung cancer (NSCLC) according to their perturbation index. Text after agent name indicates the mechanism of action. b. The perturbation index of pair-wise combination of NSCLC agents. The widths of links between two drugs are proportional to their combined PI index (see Methods ), and red links indicates the potential benefit of the combination: PI (combination) > maximum (PI (drug 1), PI (drug 2)). c. POA of gemcitabine, red (at right) circles represent all gatekeeper modules. For clarification, selected checkpoint modules (top number of gene hits) are shown as blue (at left) circles. The size of circle is proportional to the number of gene hits for each module and the link widths are also proportional to the number of gene hits from the source node (checkpoint modules). d. POA of bortezomib with same schema. Gene module names start with a 2-character header indicating the gene module definition source, PN: protein subnetwork; PA: pathway; BP: Gene Ontology biological process; MF: Gene Ontology molecular function; CC: Gene Ontology cellular component; MR: microRNA targets.

