
Figure 2.
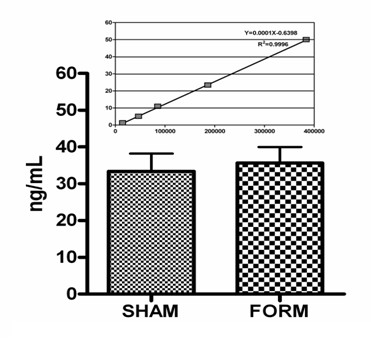
Morphine levels in SHAM and FORM groups four hours after a single injection of morphine. Data are shown as mean ± SEM. Insert: calibration curve for morphine. The levels were comparable between the two groups.
Official websites use .gov
A
.gov website belongs to an official
government organization in the United States.
Secure .gov websites use HTTPS
A lock (
) or https:// means you've safely
connected to the .gov website. Share sensitive
information only on official, secure websites.
Morphine levels in SHAM and FORM groups four hours after a single injection of morphine. Data are shown as mean ± SEM. Insert: calibration curve for morphine. The levels were comparable between the two groups.