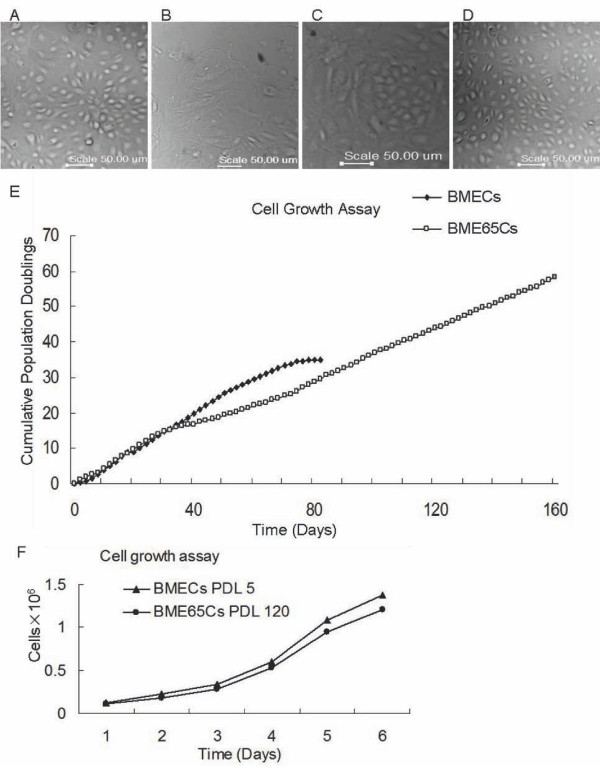
Figure 1.
Cell morphology and cell growth rate of BME65Cs cells. A. Phase-contrast images of in vitro cultivated, early passage BMECs cells (PDL 10) with typical morphologies. B. Senescent BMECs cells (PDL 34) with an increased size. C. The initially isolated population of immortalised epithelial-like cells (BME65Cs). D. BME65Cs cells (PDL 120) with the typical cobblestone pattern of freshly isolated primary BMECs cells. Bars: 50 μm. E. Growth curve of BME65Cs and BMECs cells. To determine growth rates, primary (PDL 2) and immortal mammary epithelial cells (PDL 41) were plated at a density of 3 × 10 5 cells/10 cm dish using culture conditions as described above. At 80% confluency, cells were trypsinised and subcultured every two days, and cumulative population doublings based on cell numbers was calculated. Normal BMECs cells entered the senescent state at PDL 34, and spontaneously immortalised BME65Cs colonies were generated at this stage. F. Growth rates of primary BMECs cells (PDL 5) and immortal BME65Cs cells (PDL 120). Cells were plated at a density of 1 × 10⁵ cells/10 cm dish for over 6 days of continuous culture, and cell numbers were counted each day. A similar increase in growth rate was observed between early passage MECs and immortalised BME65Cs cells.

