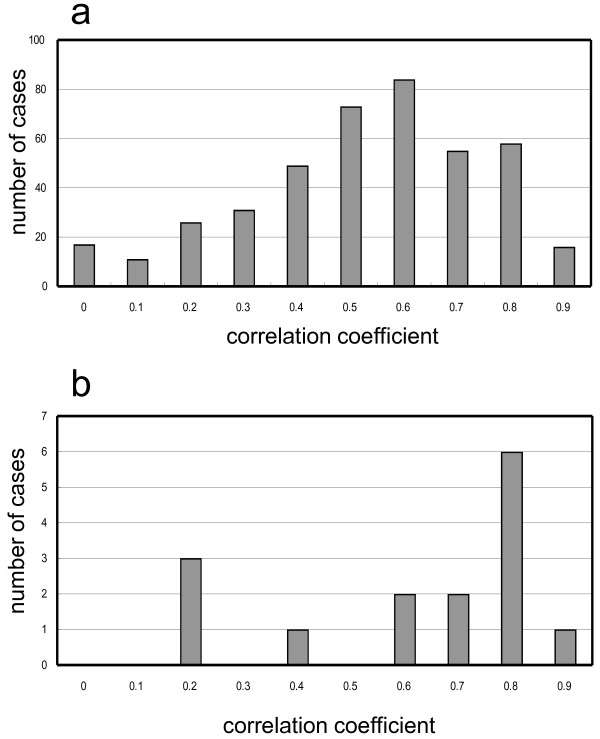
Figure 3.
A histogram of correlation coefficients of methylation patterns. Vertical axis, number of cases; horizontal axis, correlation coefficient ranges. For example, 0.8 represents values that range from 0.8 to 0.9. "0" includes cases from -0.14 to 0. a) All possible combinations of tumors from different patients; b) tumors from the same patient.

