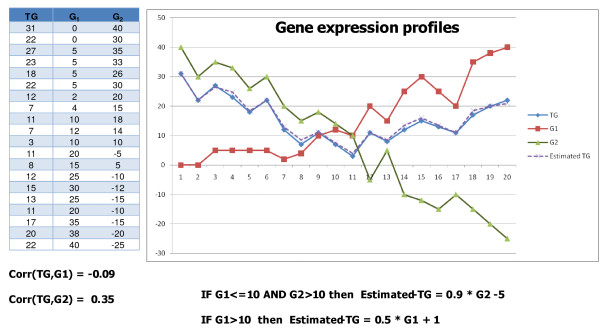
Figure 3.
Hypothetical example of localized similarities. The table represents the gene expression values from 20 samples. The correlation coefficients between the target gene TG and the two other genes are weak (ρ(TG, G1) = -0.09 and ρ(TG, G2) = 0.35). However we can observe in this hypothetical example two strong localized similarities detected by construction of this hypothetical model tree: IF G1 ≤ 10 AND G2 > 10 THEN TG = 0.9 * G2 - 5. IF G1 > 10 THEN TG = 0.5 * G1 + 1 The dot line is the results of apply the linear regression functions that estimate the target gene expression value.

