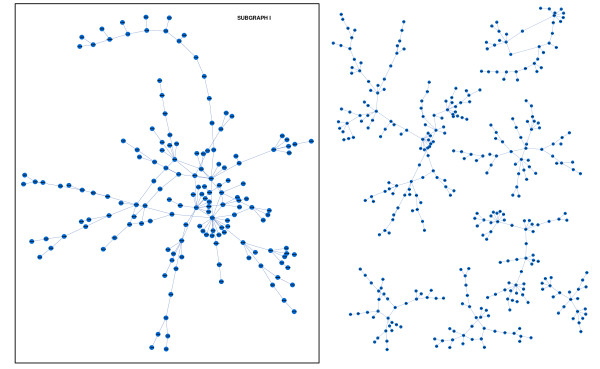
Figure 5.
Saccharomyces Cerevisiae dataset. Experiment I. Gene regression network resulting from our approach at level α = 0.05 for the BY procedure. The image was created with Cytoscape [47]. This graph has 502 nodes and 504 edges. Subgraph I is the biggest subgraph obtained and it has 154 nodes and 162 edges.

