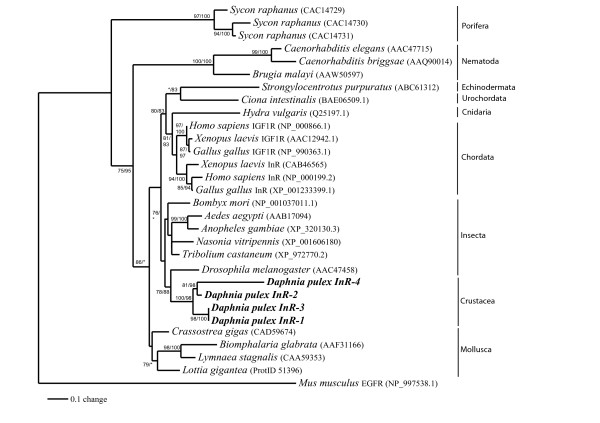
Figure 2.
Phylogenetic tree for insulin receptors tyrosine kinase constructed with maximum likelihood and Bayesian inference methods under the WAG+G model of evolution. Numbers represent percent bootstrap values (maximum likelihood/Bayesian inference); unlabeled branches indicate a value less than 75. GenBank or Ensembl accession numbers are in brackets.

