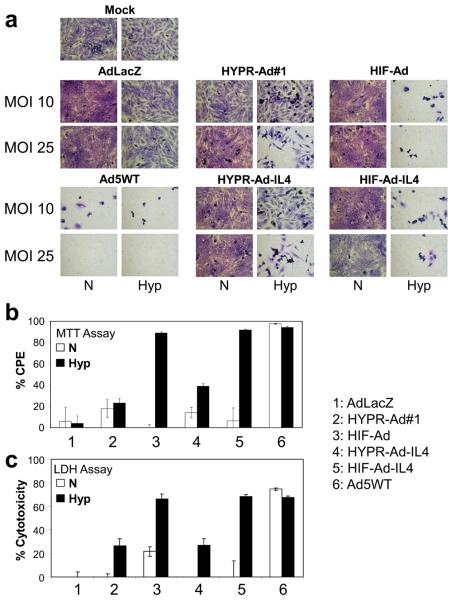
Figure 3. The HIF-Ads have dramatically improved hypoxia-dependent oncolytic activity compared to the HYPR-Ads.
(a) CPE Assay. LN229 tumor cells were mock or virus infected at MOI 10 or 25 and then maintained under normoxia versus hypoxia. Cells were visually monitored for CPE (cytolysis/detachment). Shown are photographs (100X magnification) of crystal violet stained cells taken 6 dpi. (b) MTT Assay. LN229 cells were mock or virus infected at MOI 25 and then maintained under normoxia versus hypoxia. CPE was measured by an MTT assay at 8 dpi. The percent CPE obtained with each virus was normalized to mock infected cells. This data represents the mean ± SD of two independent experiments. (c) LDH Assay. LN229 cells were mock or virus infected at MOI 25 and then maintained under normoxia vs. hypoxia. Cytotoxicity was evaluated by an LDH assay at 3 dpi. The cytotoxicity observed with each virus was normalized to mock infected cells. The data represent the mean ± SD.

