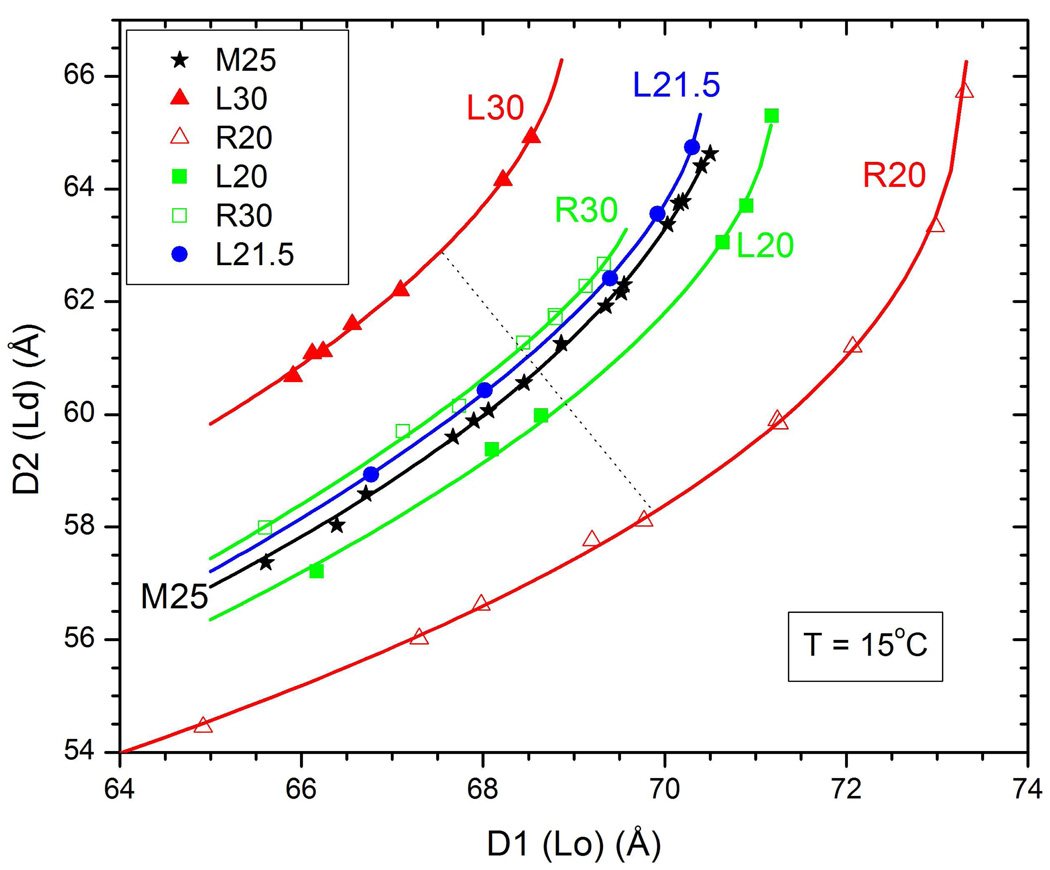
Figure 3.
D2 is the repeat spacing of the Ld phase and D1 is the repeat spacing of the Lo phase for many different equilibrated hydration levels for six samples with short names indicated in the legend. Lines are fits of Eq. 1 to the data. Deviations of individual D values from these lines are consistent with the uncertainties obtained from fitting the data in Fig. 1. The different L and R samples are equidistant from the M25 sample in the composition triangle in Fig. 2. For quantitative error analysis average differences between hydration curves along several lines like the dotted line were used.

