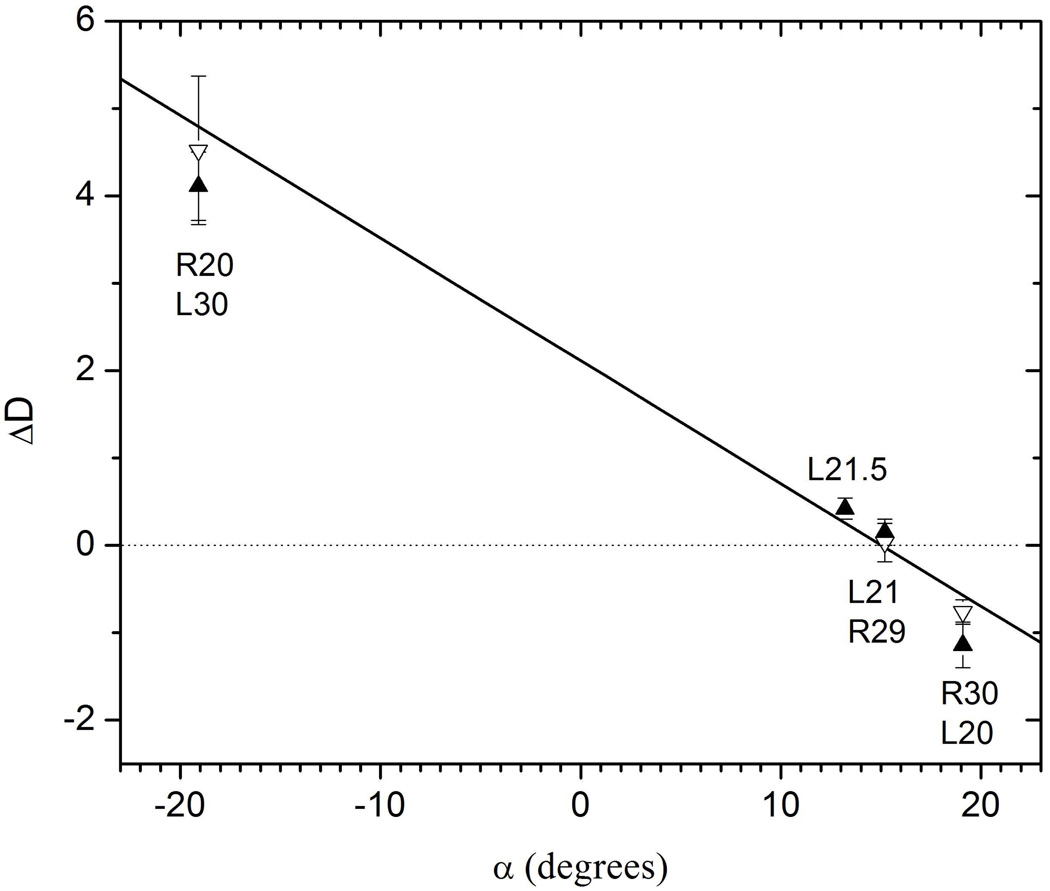
Figure 5.
Differences ΔD between curves of the double D-spacing data in Figs. 3 and 4 relative to the M25 data as a function of α which is the angle of the lines passing through M25 in Fig. 2. Solid symbols are for the L compositions and the open symbols are for the R compositions. The linear fit to all data is shown by the solid line.

