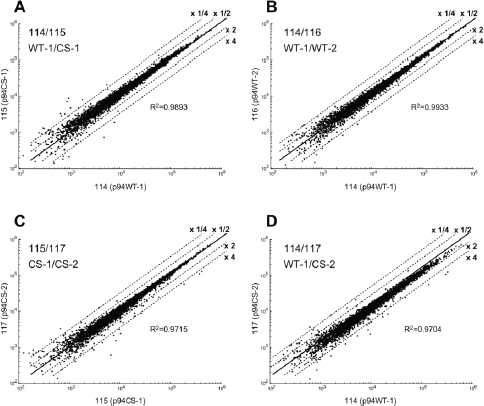
Figure 3.

Scatter plots of iTRAQT™ signals (absolute values) between 114 (WT-1) and 115 (CS-1) (A), 114 (WT-1) and 116 (WT-2) (B), 115 (CS-1) and 117 (CS-2) (C), and 114 (WT-1) and 117 (CS-2) (D). Ranges of twofold and fourfold, one-half, and one-quarter are indicated by dotted lines. R2, correlation coefficient.
