
Figure 5.
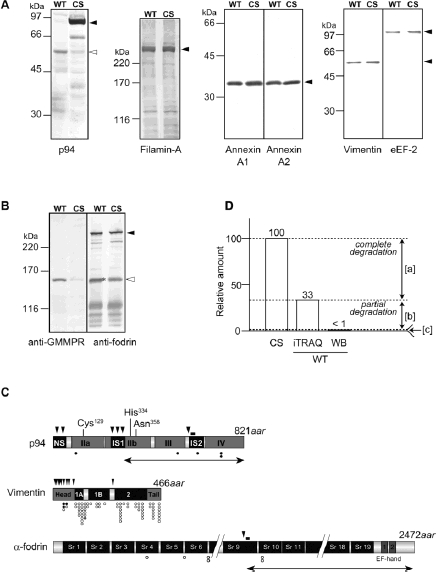
Comparison of identified proteins by iTRAQ™ analysis. (A) Western blot analysis of selected proteins using specific antibodies. Equal amounts of protein extract from COS7 cells expressing either WT or CS mutant of p94 were loaded for each blot. Closed and open arrowheads indicate the full-length and the autolyzed fragments, respectively, detected by anti-pIS2 antibody. The epitope region is indicated by a vertical bar in (C). AnxA1, annexin A1; AnxA2, annexin A2. (B) 150K fragment of α-fodrin proteolyzed at the calpain-specific site detected by anti-GMMPR in a protein sample from COS7 cells expressing WT but not CS (open arrowhead). The anti-fodrin mAb detected several fragments of different sizes in addition to full-length unproteolyzed fodrin (closed arrowhead) in both the WT and CS lanes. *, Proteolyzed 150K fragment specific to the WT sample was also detected by the anti-fodrin mAb, but the signal overlaps with an unidentified band with an almost identical mobility, which was also present in the CS sample. (C) Positional relationships between previously determined proteolytic sites and peptides identified in the present analysis. The closed arrowheads indicate autolytic sites for p94 and proteolytic sites of conventional calpains for vimentin and α-fodrin. Closed, open, and gray circles indicate the positions in proteins of peptides whose relative abundance were decreased, unchanged, or increased, respectively, in COS7 cells expressing WT p94 relative to cells expressing p94:CS. Cys, His, and Asn indicate catalytic amino acid residues in p94. Vertical bars indicate the positions of epitopes for anti-pIS2 (for p94) and anti-GMMPR (for the calpain-specific 150K proteolytic fragment of fodrin). Bidirectional arrows indicate the autolytic fragment of p94 and the calpain specific proteolytic fragment of fodrin, which correspond to the open arrowheads in (A) and (B), respectively. NS, IS1, and IS2 are p94-specific insertion sequences. IIa and IIb comprise the calpain protease domain. III and IV are C2-like and 5EF-hand motif Ca2+-binding domains, respectively. 1A, 1 B, and 2, coiled coil domains. Sr1-19, spectrin repeat. (D) Relative quantities of p94 protein/peptide by iTRAQT™ method and Western blot analysis (WB). WT p94 amounts detected by both methods are represented as relative to those of CS (CS = 100). Difference between CS and WT by iTRAQ ([a]) corresponds to portions in WT degraded completely (to amino acid) or at least smaller than the length of trypsin peptides. Difference between iTRAQ and WB in WT ([b]) corresponds to portions in WT degraded partially, larger than the length oftrypsin peptides but small enough not to be detected by WB. Region [c] mainly corresponds to the 55-kDa band in WB (A, “p94”, open arrowhead).