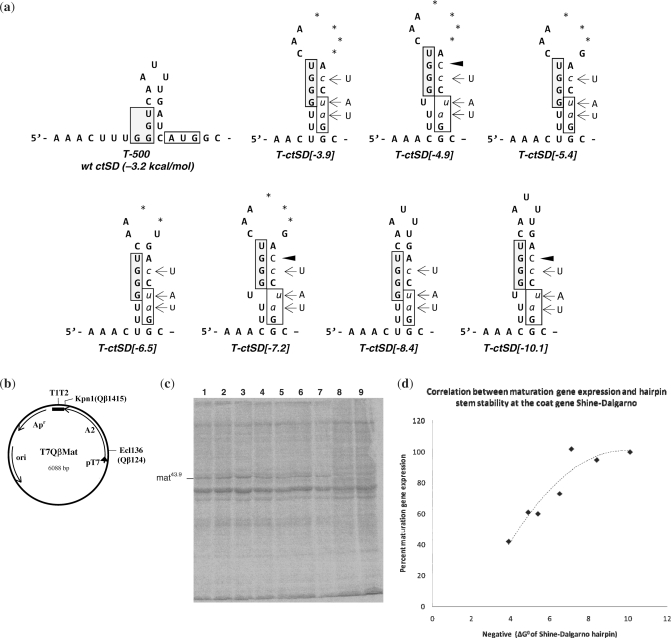
Figure 3.
(a) Putative secondary structures of the variant Qβ coat gene Shine–Dalgarno regions. Numbers in brackets indicate the predicted negative free energy (ΔG0) values. Wild-type nucleotides that were replaced are shown to the side; lower case italicized nucleotides, base substitutions; dark arrow, nucleotide insertion; boxed nucleotides, coat gene Shine–Dalgarno region and location of the wild-type coat gene initiator codon; *, nucleotide deletion; +, maturation protein generated; −, no maturation protein generated. (b) circular map of the plasmid pT7QβMat. This plasmid contains the entire Qβ maturation gene (A2) and coat Shine–Dalgarno sequence under the control of the T7 promoter (pT7). Transcripts terminate within a 3′ bacteriophage T7 5S T1T2 terminator region. Apr, ampicillin gene; ori, origin of replication. (c) PAGE analysis showing 14C-labeled proteins synthesized following growth of transformed E. coli BL21(DE3) in the presence of IPTG: lane 1, T-ctSD[-10.1]; lane 2, T-ctSD[-8.4]; lane 3, T-ctSD[-7.2]; lane 4, T-ctSD[-6.5]; lane 5, T-ctSD[-5.4], lane 6, T-ctSD[-4.9]; lane 7, T-ctSD[-3.9]. Lanes 8 and 9 are proteins from uninduced cells transformed with the parent plasmid pT7QβMat. (Note that the ctSD[-8.4] mutation in transcript T-ctSD[-8.4] is the same as the heSD2 mutation.) (d) The ratio of maturation protein synthesized relative to total protein expressed for each of the above Qβ coat gene Shine–Dalgarno mutants. Values were determined from phosphorimage analysis of 14C-labeled proteins generated after 30 min of induction with IPTG. For each, the percent of maturation protein synthesized was determined relative to the maximum amount (100%) that was synthesized from the T-502/heSD2 transcript (Figure 2).

