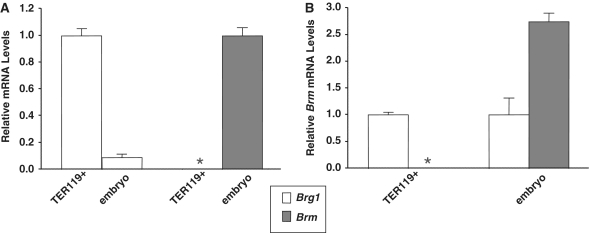
Figure 2.
Brm is not expressed in erythroid cells of the fetal liver. (A) RT-qPCR analysis of Brg1 and Brm mRNA levels normalized to Gapdh levels in wild-type flow-sorted erythroid cells (TER119+) and whole mouse embryos minus their fetal livers (embryo) at E12.5. The white histograms on the left show Brg1 expression of embryos relative to TER119+ samples. The gray asterisk on the right indicates Brm mRNA levels are below the limit of detection in TER119+ samples and is compared to Brm expression in embryoss (gray histogram). Each histogram represents the mean ± SE for two (TER119+) or three (embryo) independent experiments. (B) Brm mRNA levels relative to Brg1 mRNA levels based on data presented in (A). For TER119+ (left) and embryo samples (right), Brg1 mRNA levels (white histograms) are set at 1.0 and Brm mRNA levels (gray asterisk/histogram) are shown in proportion. The asterisk indicates Brm was analyzed for TER119 samples but mRNA was not detected.

