Figure 2.
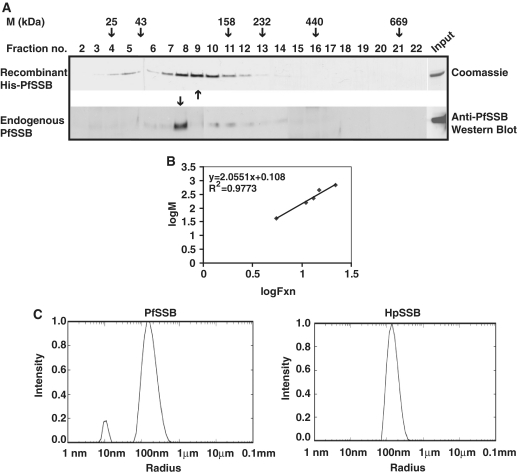
Oligomeric properties of PfSSB. (A) Sucrose density gradient analysis of recombinant Pf SSB and endogenous Pf SSB. Recombinant PfSSB was subjected to sucrose density gradient ultracentrifugation and different fractions were collected. Upper panel shows the coomassie stained SDS–PAGE gel of recombinant protein of different fractions following sucrose density gradient. The lower panel shows the western blot analysis of different fractions following sucrose density gradient ultracentrifugation of Plasmodium extract using anti-PfSSB antibodies. Arrowheads indicate peak fractions of elution profile of recombinant and endogenous PfSSB. Peak fractions of molecular mass markers following ultracentrifugation are shown on the top. (B) The graph represents the standard curve of log of peak fraction number against log of molecular mass of known marker proteins. (C) Dynamic light-scattering analysis of HpSSB and PfSSB. The right panel shows particle size distribution of HpSSB that indicates the accumulation of a single species population of average hydrodynamic diameter of 139.1 ± 4.125 nm. The major population of Pf SSB is found to be accumulated in the average hydrodynamic diameter of 152.133 ± 2.65 nm (left panel).

