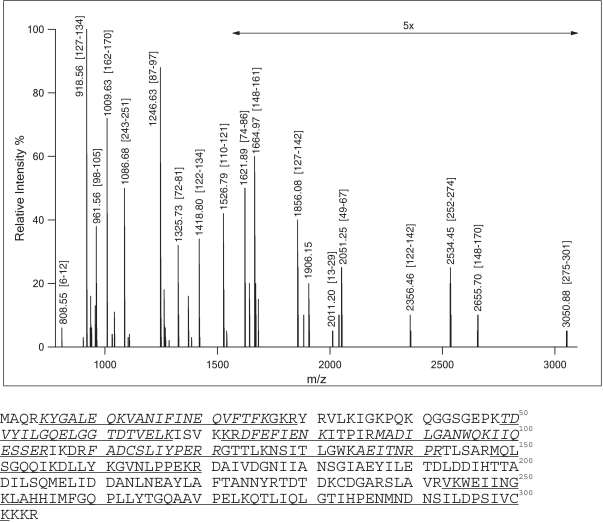
Figure 2.
BspRI endonuclease sequence coverage by mass spectrometry. Upper panel, MALDI–TOF mass spectrum of BspRI unfractionated tryptic digest. Numbers in brackets indicate sequence positions of the peptides. Lower panel, amino acid sequence of BspRI restriction endonuclease. Sequences identified from MS/MS data (italic) (Table 1) or from mass only are underlined.

