Figure 4.
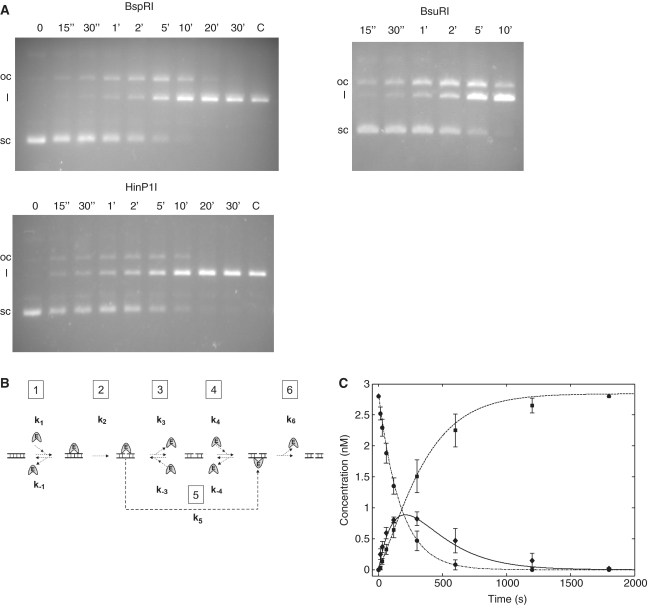
Digestion of the single-site plasmid pC194 with BspRI, HinP1I and BsuRI endonucleases. (A) Agarose gel electrophoresis of the digestion products. Reaction times are shown above the lanes. Digestions were performed as described in ‘Materials and Methods’ section. Sc, l and oc denote supercoiled, linear and open circular forms, respectively. (B) Proposed kinetic scheme for DNA cleavage by BspRI endonuclease. Step 1, equilibrium binding to uncut DNA; step 2, nicking of the first strand; step 3, equilibrium binding to nicked DNA, BspRI facing the nicked strand; step 4, equilibrium binding to nicked DNA, BspRI facing the intact strand; step 5, transposition of BspRI from the nicked strand to the uncut strand; step 6, cleaving the second strand. (C) Time course of digestion of supercoiled plasmid DNA with BspRI. pC194 plasmid DNA was digested for the indicated times and the plasmid forms were quantitated as described in ‘Materials and Methods’ section. Experimental data are denoted by symbols (circle, supercoiled; diamond, nicked; square, linear). Lines represent results of the simulation (dashed–dotted, supercoiled; solid, nicked; dashed, linear). Error bars indicate the standard error of the data calculated from four parallel experiments.

