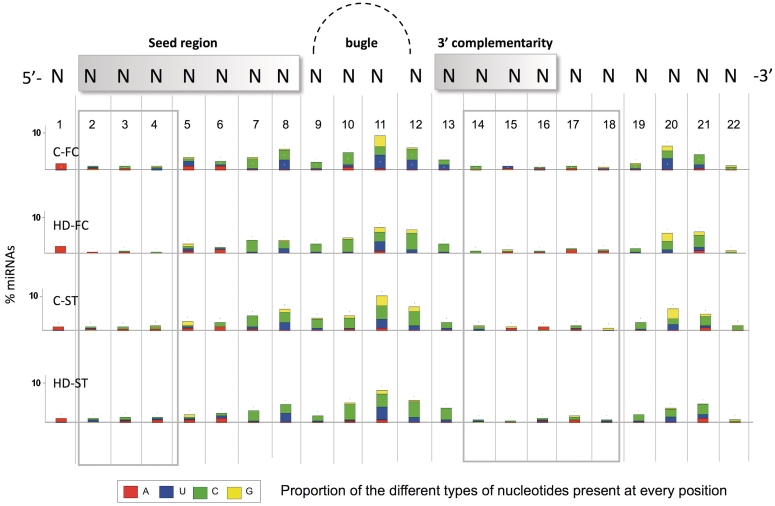
Figure 3.
Percentage of miRNAs with nucleotide substitution variants, according to the nucleotide position. A scheme of the mature miRNA appears in the upper part of the figure showing the main regions involved in 3′-UTR gene targeting: 5′-seed (nt 2–8) the cleavage (nt 10–12) and anchor (nt 13–16) sites. A gray square highlights the less variable positions along the miRNA. The color pattern in the bars indicates the proportion of a specific type of nucleotide present in the isomiR, at every position: A (red), U (blue), C (green) and G (orange). In this analysis, nucleotide substitution variants with more than 50 counts in each library are considered.

