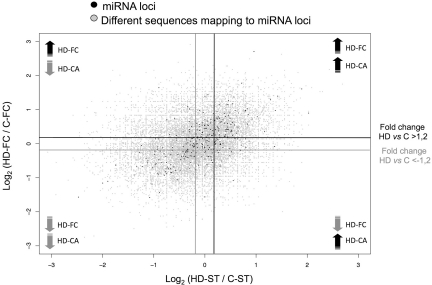
Figure 4.
Differential expression in HD-ST (x-axis) and HD-FC (y-axis) samples. Black spots show the miRNA loci and gray spots show all the sequences (reference miRNAs and isomiRS) mapping onto the miRNA loci. The darker and lighter lines mark the limits of expression fold changes in HD versus control samples above 1.2 and below –1.2, respectively.

