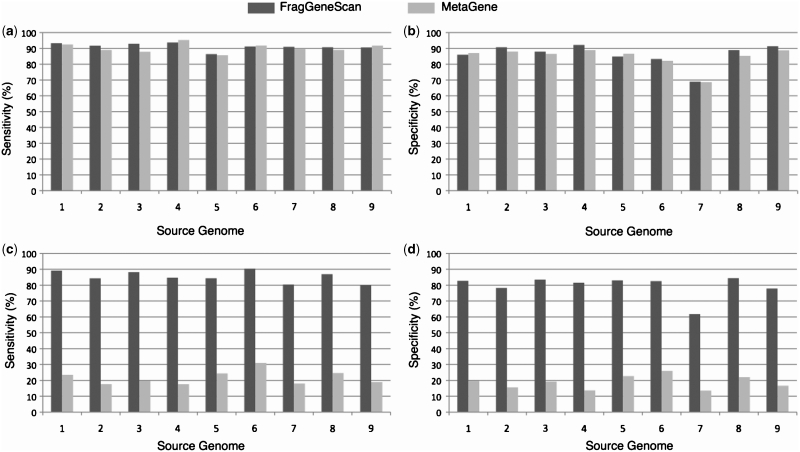
Figure 3.
Gene prediction performance in simulated reads of 400 bases without sequencing error (a) and (b) and with 1% sequencing error rate (c) and (d). The x-axis denotes the source genomes from which the short reads were simulated: 1. E. coli; 2. H. pylori; 3. B. subtilis; 4. B. aphidicola; 5. C. tepidum; 6. B. pseudomallei; 7. W. endosymbiont; 8. C. jeikeium; 9. P. marinus. The y-axis denotes sensitivity in (a) and (c), and specificity in (b) and (d).

