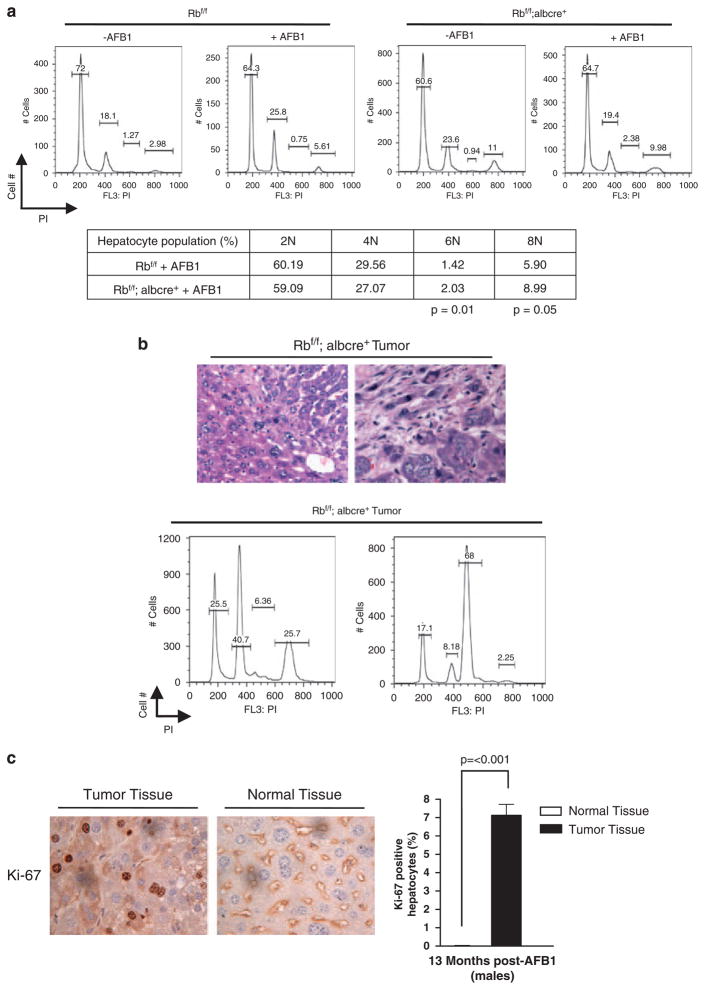
Figure 6.
Retinoblastoma (RB)-deficient mice livers and tumors show genome instability. (a) Representative Flow cytometry traces for each condition. The table represents mean of each hepatocyte population for 2, 4, 6 and 8N, expressed as a percentage. (b) Images of tumor sections stained with hematoxylin and eosin (H and E) to show heterogeneity of tissue. Furthermore, representative Flow cytometry traces of Rb-deficient aflatoxin B1 (AFB1)-treated tumors, and representative images of mitotic figures in AFB1-treated Rb-deficient tumors. (c) Images of non-neoplastic tissue and tumor tissue stained against Ki-67. The plot depicts tumor and normal tissue levels of Ki-67.

