
Fig. 2.
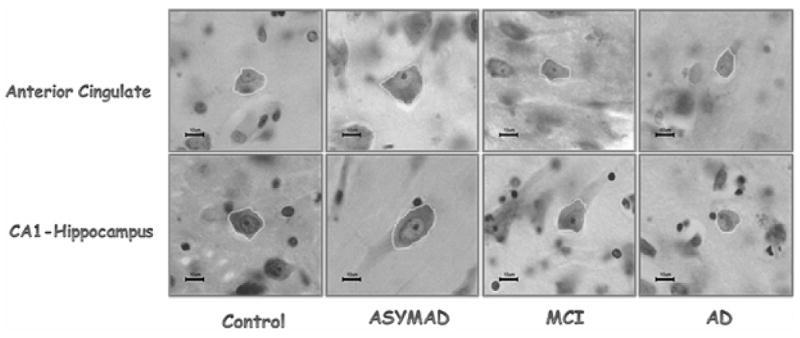
This panel illustrates representative neurons in the anterior cingulate (top row) and CA1-hippocampus (bottom row) in each study group. Note the neuronal hypertrophy in ASYMAD. Nissl stain sections. All magnification bars are 10 μm. (Colours are visible in the electronic version of the article at www.iospress.nl.)