Figure 5.
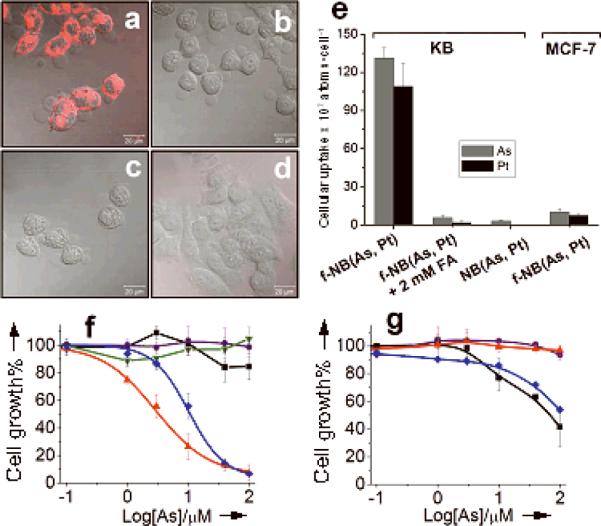
Comparison of cellular drug uptake and cytotoxicity of various drug formulations. Confocal micrograghs (merged with DIC images) showing cellular uptake of (a) f-NB(As, Pt), (b) f-NB(As, Pt) + 2 mM FA, (c) NB(As, Pt) by KB cells, and of (d) f-NB(As, Pt) by MCF-7 cells after 3 h at 37°C. Liposomes were labeled with rhodamine (Rh). Scale bar: 20 μm. e) KB and MCF-7 cellular arsenic and platinum uptake. Cytotoxic effects of f-NB(As, Pt) (▲), f-NB(As, Pt) + 2 mM FA (▼), NB(As, Pt) (●), As2O3 (■) and aqua-cisPt (◆) towards KB (f) and MCF-7 (g) cells. Cells exposed to drugs at 37°C for 3 h, washed by PBS and further incubated up to 72 h in drug-free medium.

