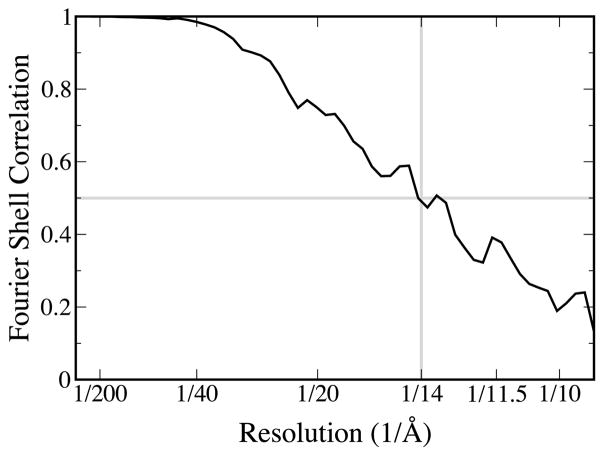
Figure 2.
Fourier Shell Correlation (FSC) curve for the reconstruction as produced by the EMAN program eotest. To avoid any possibility of initial model bias, no reference was made to any previous model during refinement. The structure was refined from an initial model generated from automatically generated top and side views of the particle with 4-fold symmetry enforced. The overall refinement methodology was the same as a typical iterative EMAN refinement: projection-based particle classification: generation of a contrast transfer function (CTF)-corrected average for each class followed by reconstruction of a new 3D model from the class-averages.29 This refinement is iterated until convergence is achieved. The algorithm improvements which allowed this resolution improvement are described in detail elsewhere.10 First, the precision of the 2D alignment routine was improved, producing more accurate classifications. Second, classification accuracy was also enhanced through use of a new similarity criterion incorporating a true per-particle Wiener filter. Third, the resolution of the individual class-averages was improved through gradual reduction of the iterative self-alignment process used to produce class-averages. Resolution in the final reconstruction was determined using the standard technique of splitting the data into even and odd halves and calculating a FSC curve. In this case the most conservative, 0.5 threshold value was used. Since the determined 14 Å resolution is already approaching the traditional sampling limit of 3× oversampling, claiming any resolution beyond this point would not be justified.

