
Figure 3.
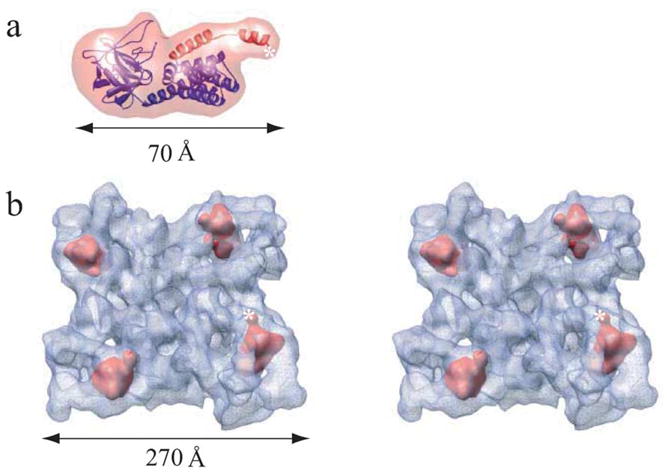
Localization of the IP3-like region of RyR1. (a) Homology model for the InP3-like RyR1 domain (blue/red ribbon) and corresponding 14 Å density map (transparent red) generated using EMAN. The sequence corresponding to the LZ1 region residues 541–572 is shown with red ribbon. A homology model was generated by mapping of the coordinates of the X-ray structure of the IP3-binding core region (1N4K)20 and the sequence residues 216–572 of RyR1 aligned to them. The model was further enhanced by the addition of side-chains using the SCWL algorithm.30 Sequence alignment, secondary structure prediction and homology modeling were performed using 3D-PSSM Fold Recognition server. (b) Fitting of 14 Å electron density map of the IP3-like domain within RyR1 tetramer shown in tilted stereo top-view. Assignment of mass densities for the IP3-like domain was performed using 6D fitting program Foldhunter as previously described.3 The top four correlation peaks with local correlation coefficients of about 0.91 (Foldhunter score) are found in the clamp-shaped domain of each of the four monomers in the RyR1 reconstruction. This fit had a z-score of 1.97. z-Score is a statistical measure of the number of standard deviations from the mean, which, in this case, corresponds a confidence level greater than 95%. A star marks the C terminus of the modeled region.